Open Access
Fig. 4
Download original image
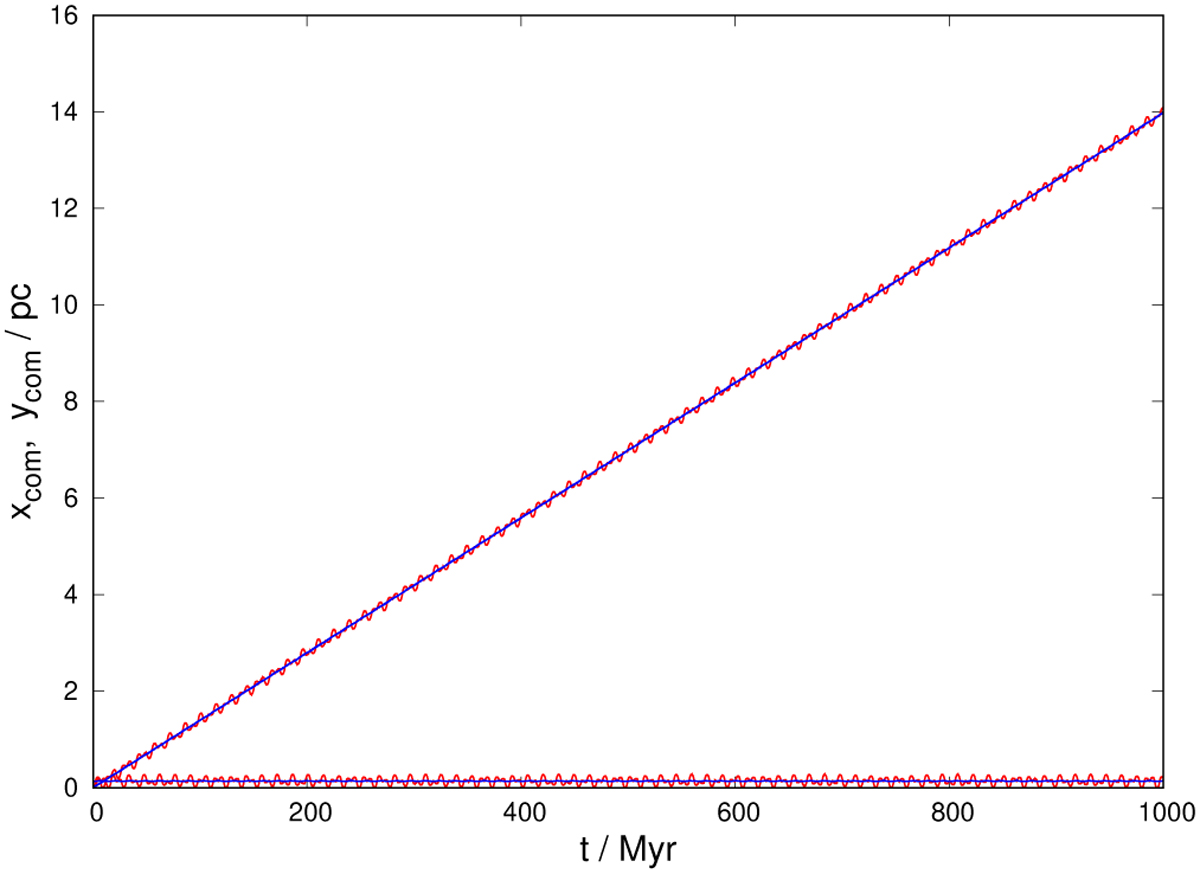
Centre of mass motions. The straight blue lines refer to the MLD-centre of mass (Eq. (46)) whereas the wobbling red curves show the Newtonian centre of mass, ![]() . The x-component of both centers of mass runs horizontally, the y-component increases continuously.
. The x-component of both centers of mass runs horizontally, the y-component increases continuously.
Current usage metrics show cumulative count of Article Views (full-text article views including HTML views, PDF and ePub downloads, according to the available data) and Abstracts Views on Vision4Press platform.
Data correspond to usage on the plateform after 2015. The current usage metrics is available 48-96 hours after online publication and is updated daily on week days.
Initial download of the metrics may take a while.