Open Access
Fig. 22
Download original image
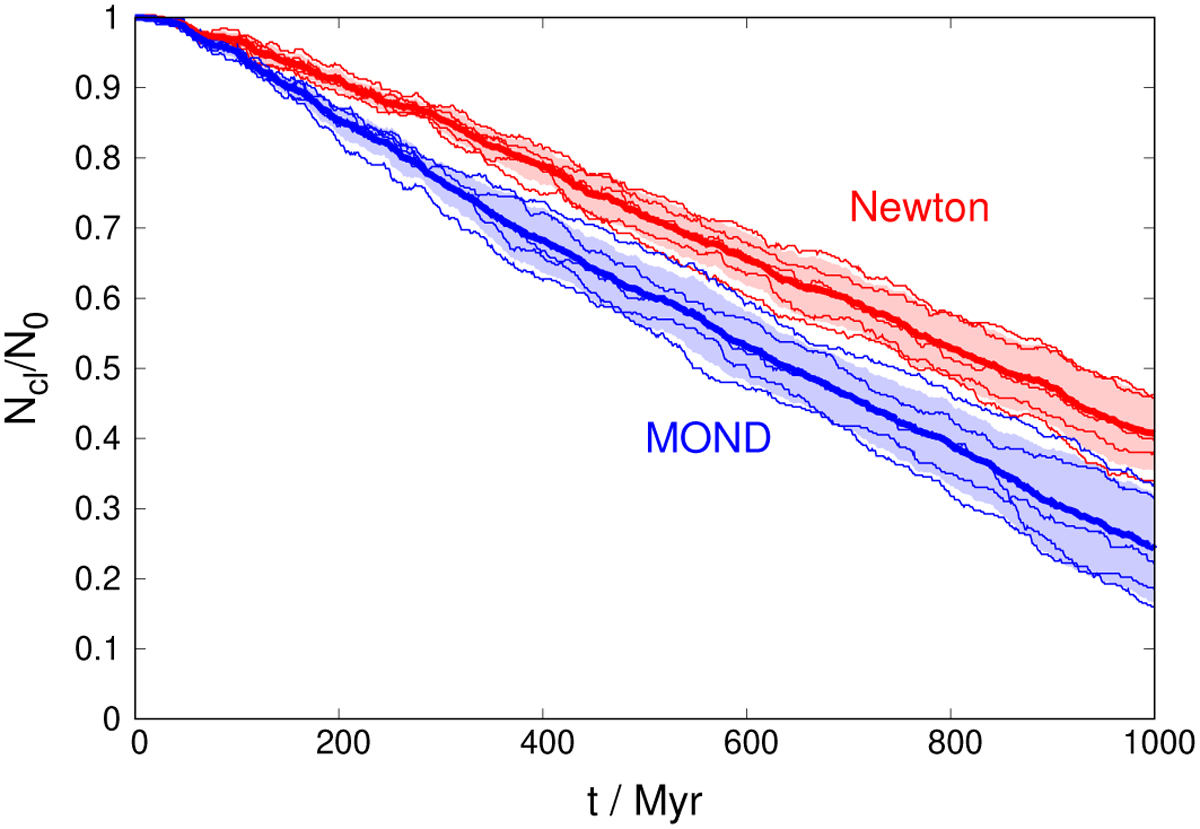
Evolution of the cluster member number fraction. Each of the ten models, five Newtonian (red) and five MONDian (blue) models, are shown as thin solid lines. The evolution of the mean values are given by thick solid lines. The light-blue and the light-red areas indicate the 1σ region around the mean value.
Current usage metrics show cumulative count of Article Views (full-text article views including HTML views, PDF and ePub downloads, according to the available data) and Abstracts Views on Vision4Press platform.
Data correspond to usage on the plateform after 2015. The current usage metrics is available 48-96 hours after online publication and is updated daily on week days.
Initial download of the metrics may take a while.