Fig. 1
Download original image
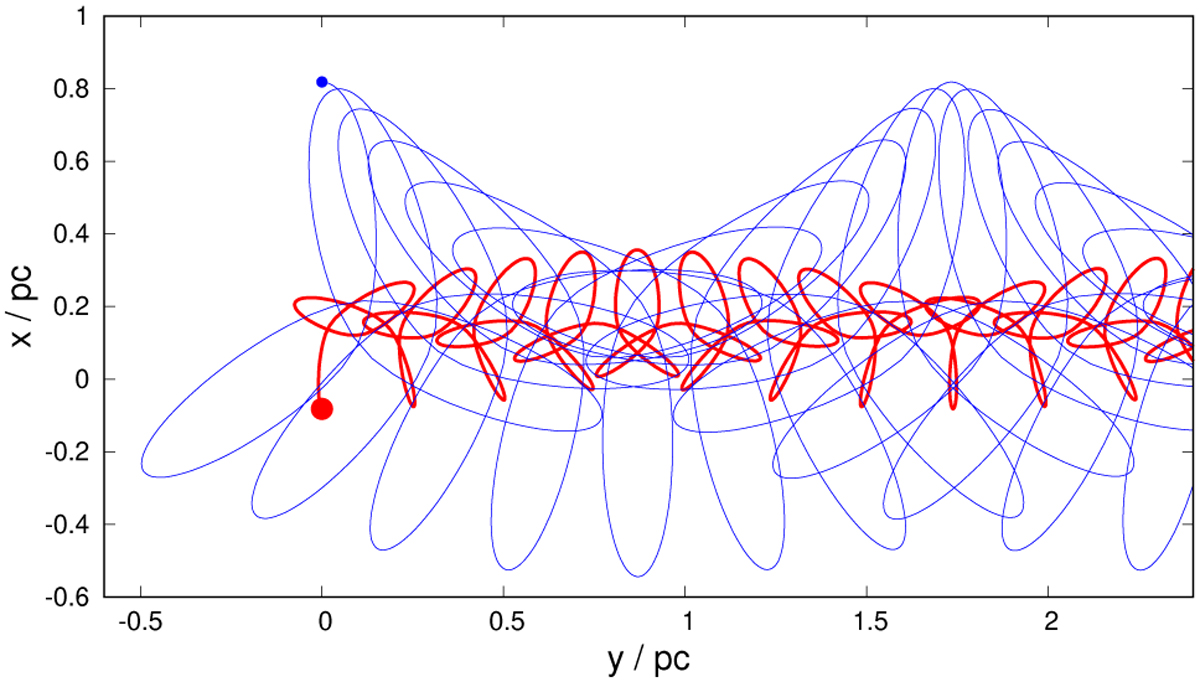
Orbital evolution of a deep MOND MLD-binary: the thick red curve shows the trajectory of the more massive particle with m1 = 2 M⊙, while the thin blue curve shows the trajectory of the less massive particle with m1 = 0.2 M⊙. The large red filled circle indicates the initial position of the more massive particle, the small blue filled circle the initial position of the less massive particle.
Current usage metrics show cumulative count of Article Views (full-text article views including HTML views, PDF and ePub downloads, according to the available data) and Abstracts Views on Vision4Press platform.
Data correspond to usage on the plateform after 2015. The current usage metrics is available 48-96 hours after online publication and is updated daily on week days.
Initial download of the metrics may take a while.