Open Access
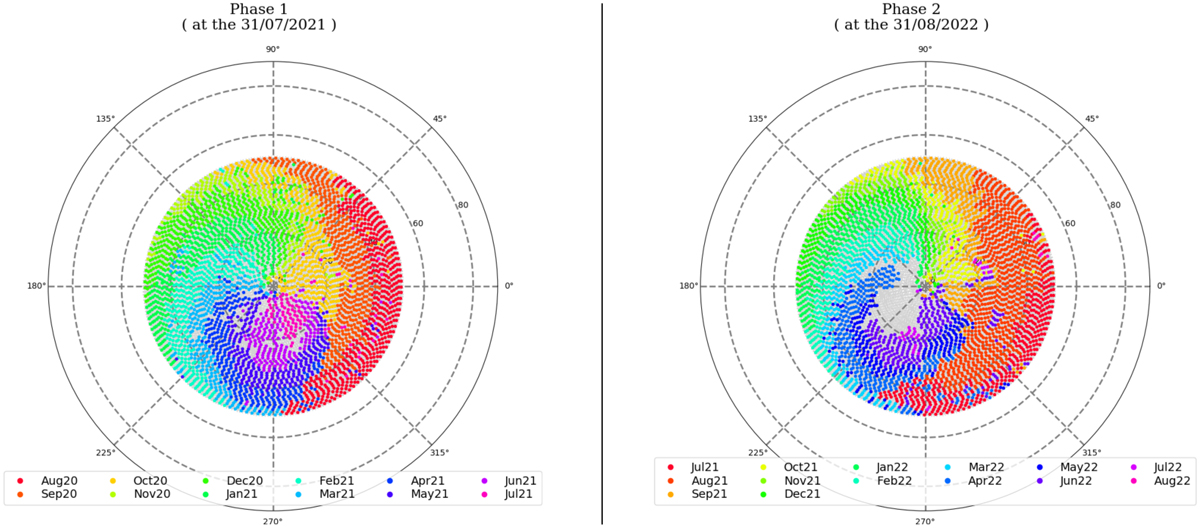
Fig. 9
Download original image
Stereographic projection of the observed sky month by month. Left: observations of phase one from August 2020 in red to July 2021 in purple. Right: observations of phase two from July 2021 in red to August 2022 in purple. Grey areas represent sky areas that remain to be observed.
Current usage metrics show cumulative count of Article Views (full-text article views including HTML views, PDF and ePub downloads, according to the available data) and Abstracts Views on Vision4Press platform.
Data correspond to usage on the plateform after 2015. The current usage metrics is available 48-96 hours after online publication and is updated daily on week days.
Initial download of the metrics may take a while.