Fig. 13
Download original image
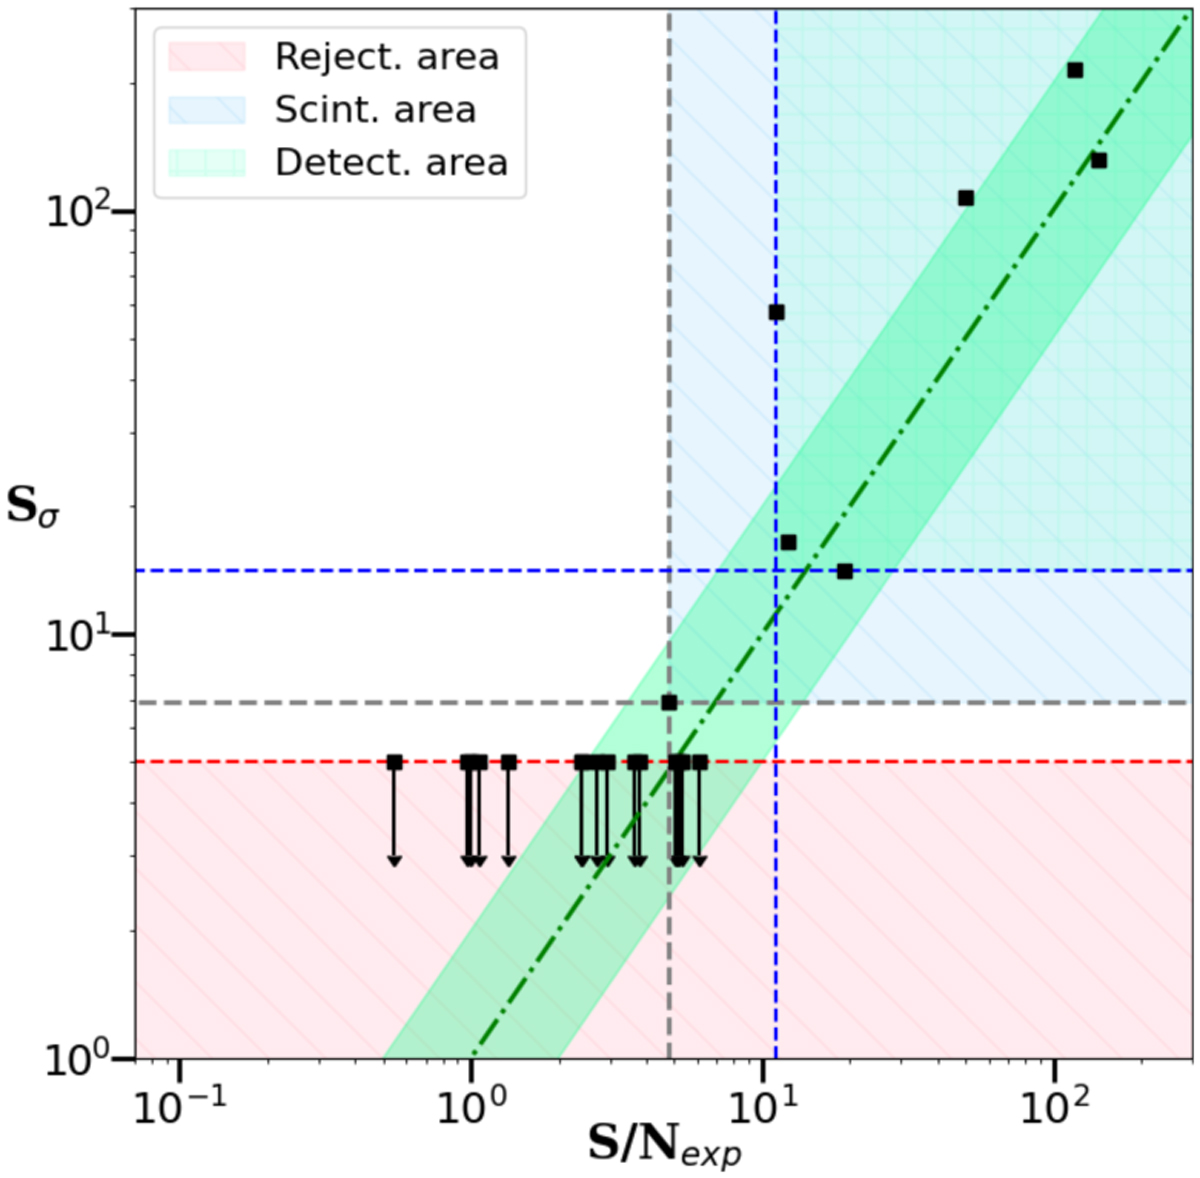
Significance provided by PREPFOLD relative to the corresponding expected S/N. The green area indicates the values of supposed sure detectability by the NPBS. The light blue area marks values for which the detection is possible depending on scintillation. The red area represents the values for which a pulsar candidate is rejected by the search pipeline (Sσ < 5σ). The green diagonal contour represents the slope 1 between the significance and the expected S/N, with an error bar of factor 2.
Current usage metrics show cumulative count of Article Views (full-text article views including HTML views, PDF and ePub downloads, according to the available data) and Abstracts Views on Vision4Press platform.
Data correspond to usage on the plateform after 2015. The current usage metrics is available 48-96 hours after online publication and is updated daily on week days.
Initial download of the metrics may take a while.