Fig. 12
Download original image
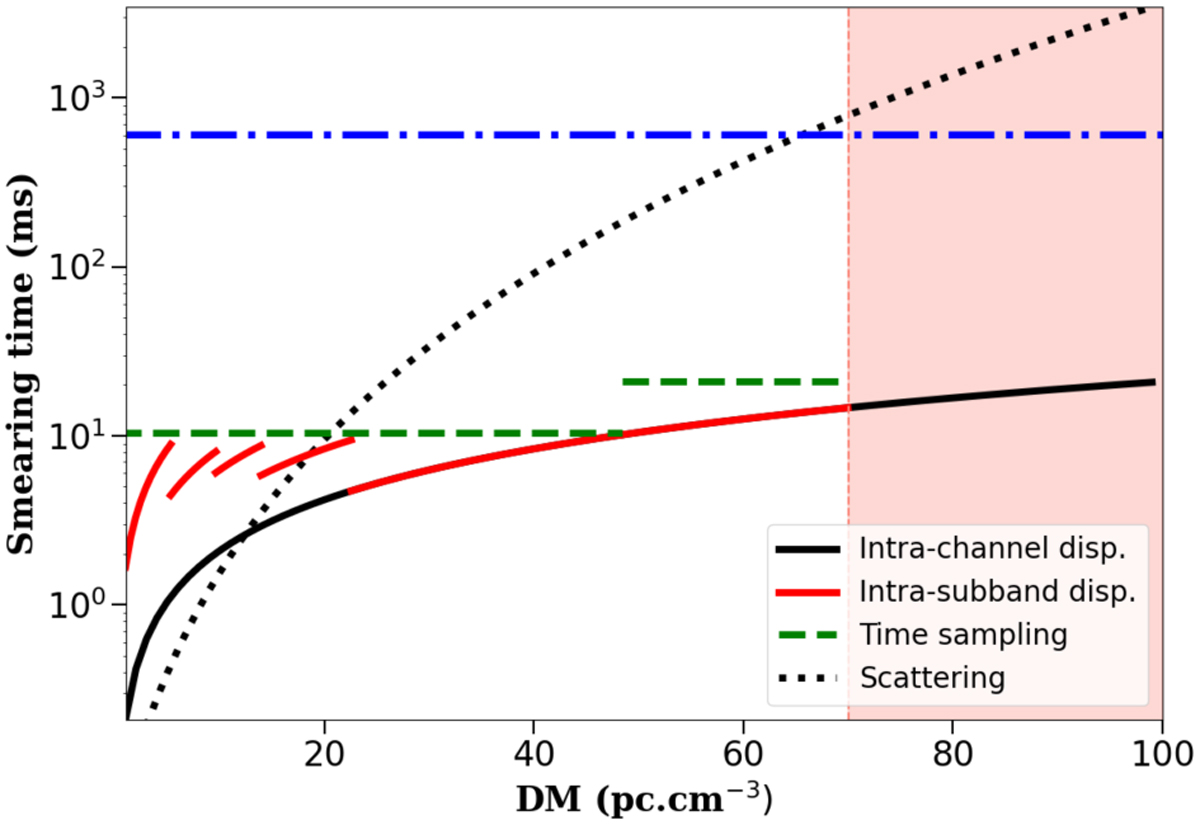
Dispersive and scattering smearing time as a function of the DM. The black line represents the intra-channel dispersive smearing. The red lines correspond to the intra-subband dispersive smearing. The dashed green lines indicate the used time sampling. On the top, the dotted black line shows the average scatter broadening, and the blue line indicates the median of the period of all the non-MSPs in the ATNF catalogue. The pink area marks the DMs not searched for in the NPBS.
Current usage metrics show cumulative count of Article Views (full-text article views including HTML views, PDF and ePub downloads, according to the available data) and Abstracts Views on Vision4Press platform.
Data correspond to usage on the plateform after 2015. The current usage metrics is available 48-96 hours after online publication and is updated daily on week days.
Initial download of the metrics may take a while.