Fig. 11
Download original image
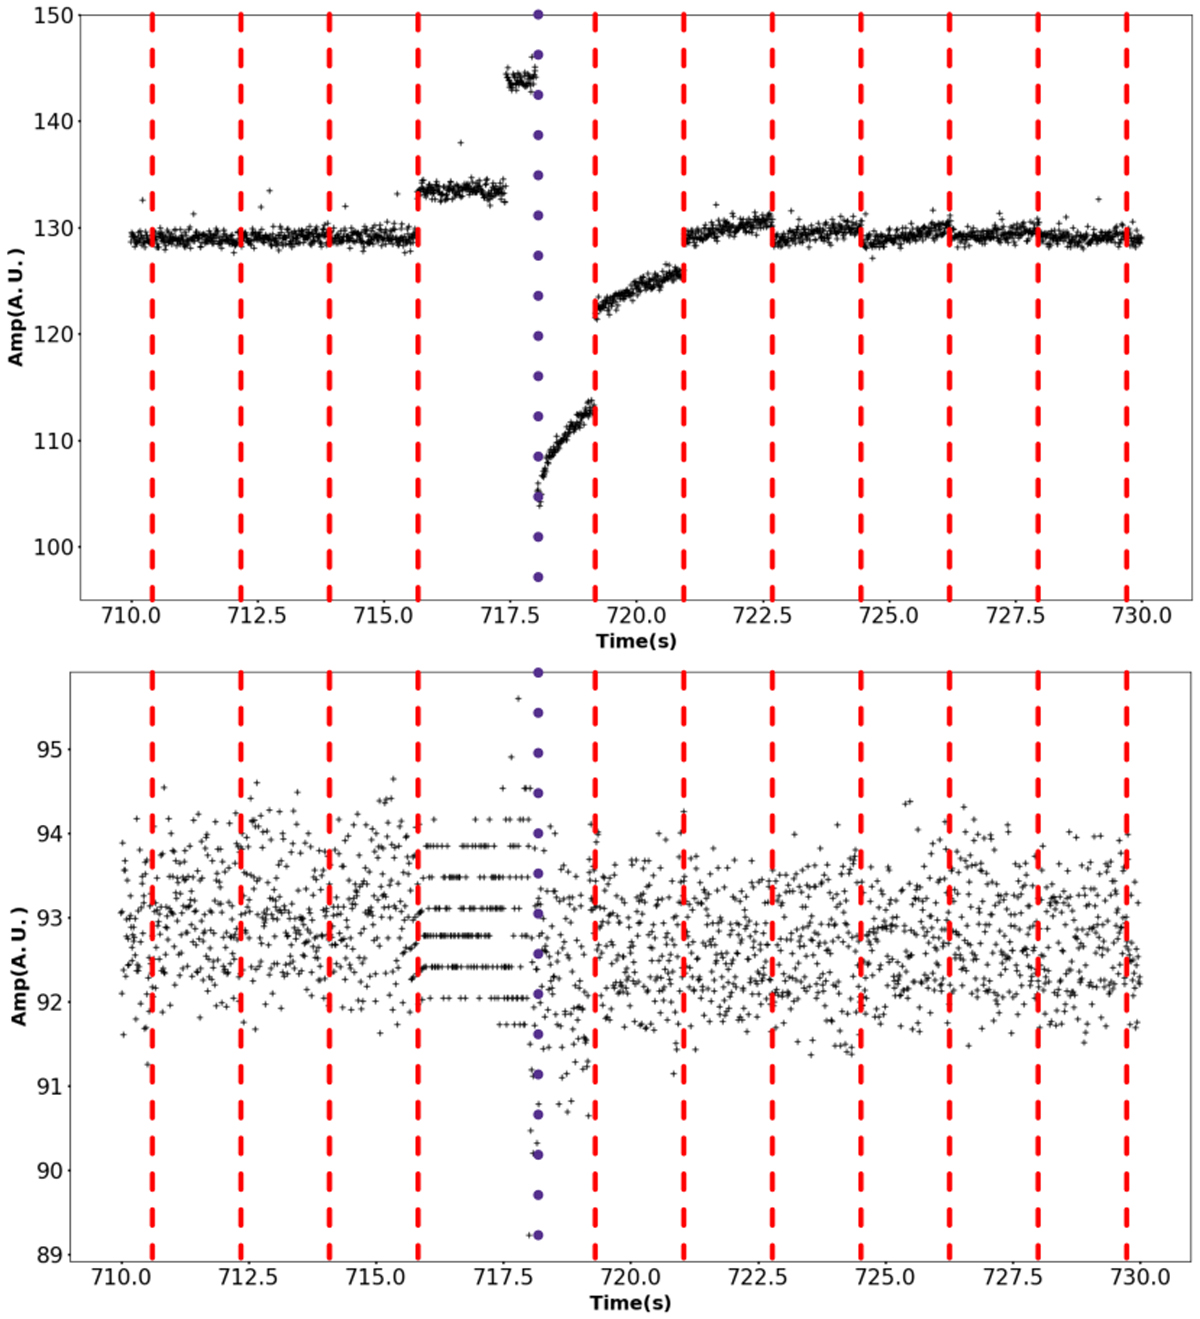
Comparison of the frequency-integrated time series of an observation of the NPBS before and after the flattening step. Top panel: part of the original time series with the tracking adjustment of the analogue beam of NenuFAR just before 720 s (blue dotted line). Bottom panel: same part of the time series after the flattening step. Red dashed lines indicate the positions of the short discontinuities every 1.7 s generated during the data conversion into an 8-bit filterbank.
Current usage metrics show cumulative count of Article Views (full-text article views including HTML views, PDF and ePub downloads, according to the available data) and Abstracts Views on Vision4Press platform.
Data correspond to usage on the plateform after 2015. The current usage metrics is available 48-96 hours after online publication and is updated daily on week days.
Initial download of the metrics may take a while.