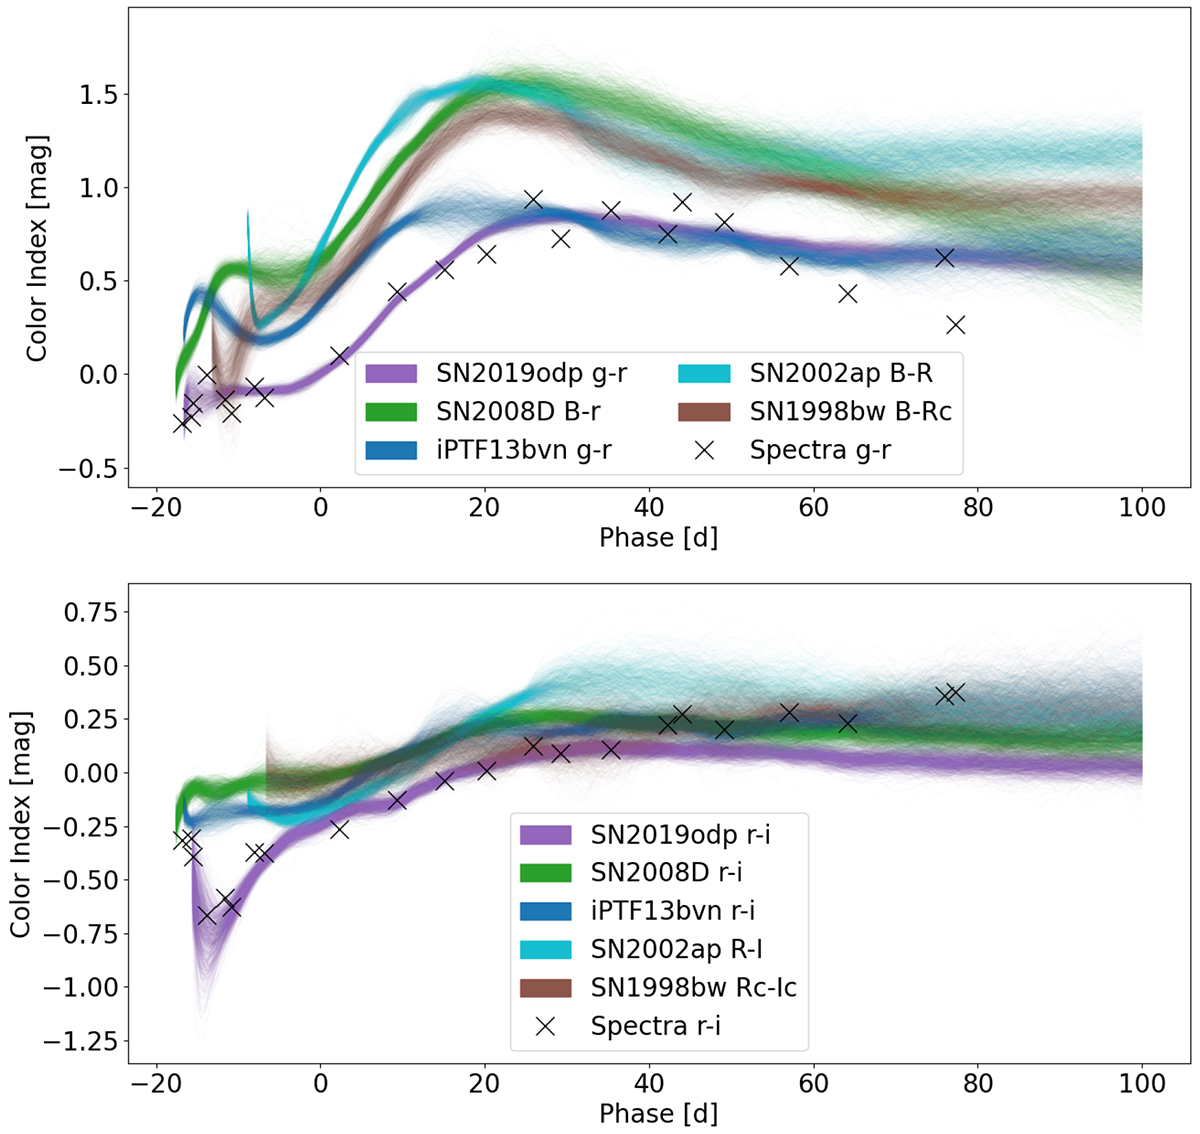
Fig. 9.
Download original image
Colour evolution of SN 2019odp and the comparison objects. The top panel shows the g − r colour (or corresponding Johnson colour). The lower panel shows the r − i colour (or corresponding Johnson colour). For each transient, we sampled 1000 realisations of the supernova light curve from the interpolation kernel. For SN 2019odp, we also included synthetic photometry based on the observed spectra as a consistency check (using the same filter curve as for the photometric dataset). They are denoted with black crosses.
Current usage metrics show cumulative count of Article Views (full-text article views including HTML views, PDF and ePub downloads, according to the available data) and Abstracts Views on Vision4Press platform.
Data correspond to usage on the plateform after 2015. The current usage metrics is available 48-96 hours after online publication and is updated daily on week days.
Initial download of the metrics may take a while.