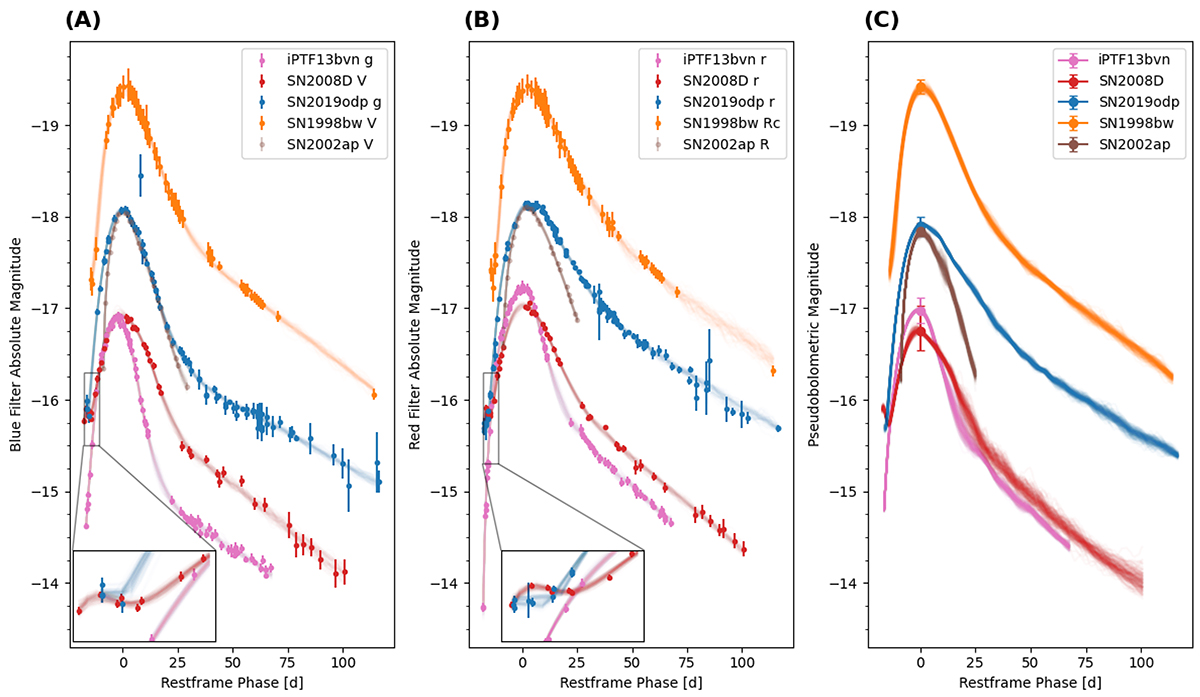
Fig. 8.
Download original image
Comparison of the evolution of the absolute light curves in g/V (panel A, left) and r/R (panel B, middle) bands between SN 2019odp and selected comparison objects. In addition, the pseudo-bolometric light curve derived using the Lyman method is shown (panel C, right). In the pseudo-bolometric light curve (panel C), the error bars around the peak represent the combined error from the distance uncertainty, extinction uncertainty, and the scatter from the Lyman relation. The interpolated light curves for each supernova have been placed over the observed datapoints in the same colour. These were used to derive the pseudo-bolometric light curves in the right panel. The bottom left corners of panels A and B zoom in on the very early evolution.
Current usage metrics show cumulative count of Article Views (full-text article views including HTML views, PDF and ePub downloads, according to the available data) and Abstracts Views on Vision4Press platform.
Data correspond to usage on the plateform after 2015. The current usage metrics is available 48-96 hours after online publication and is updated daily on week days.
Initial download of the metrics may take a while.