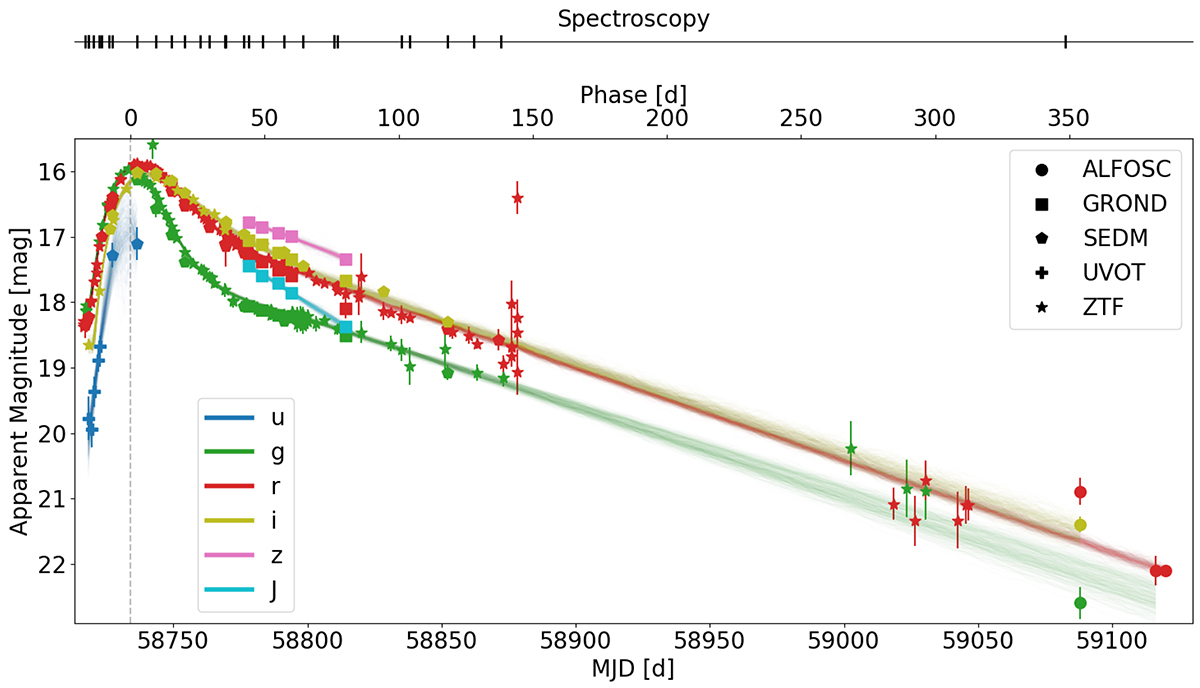
Fig. 3.
Download original image
Photometric evolution of SN 2019odp in the ugriz′J bands using the combined photometry dataset. The colour denotes the band and the different markers denote the source instrument. The faintly overlaid light curves are light curve realisations drawn from the conditioned Gaussian process interpolation kernel (see Sect. 2.4 for a detailed description). The light curves have not been corrected for extinction. The times of spectroscopic observations are marked in the top bar by vertical lines.
Current usage metrics show cumulative count of Article Views (full-text article views including HTML views, PDF and ePub downloads, according to the available data) and Abstracts Views on Vision4Press platform.
Data correspond to usage on the plateform after 2015. The current usage metrics is available 48-96 hours after online publication and is updated daily on week days.
Initial download of the metrics may take a while.