Fig. 14.
Download original image
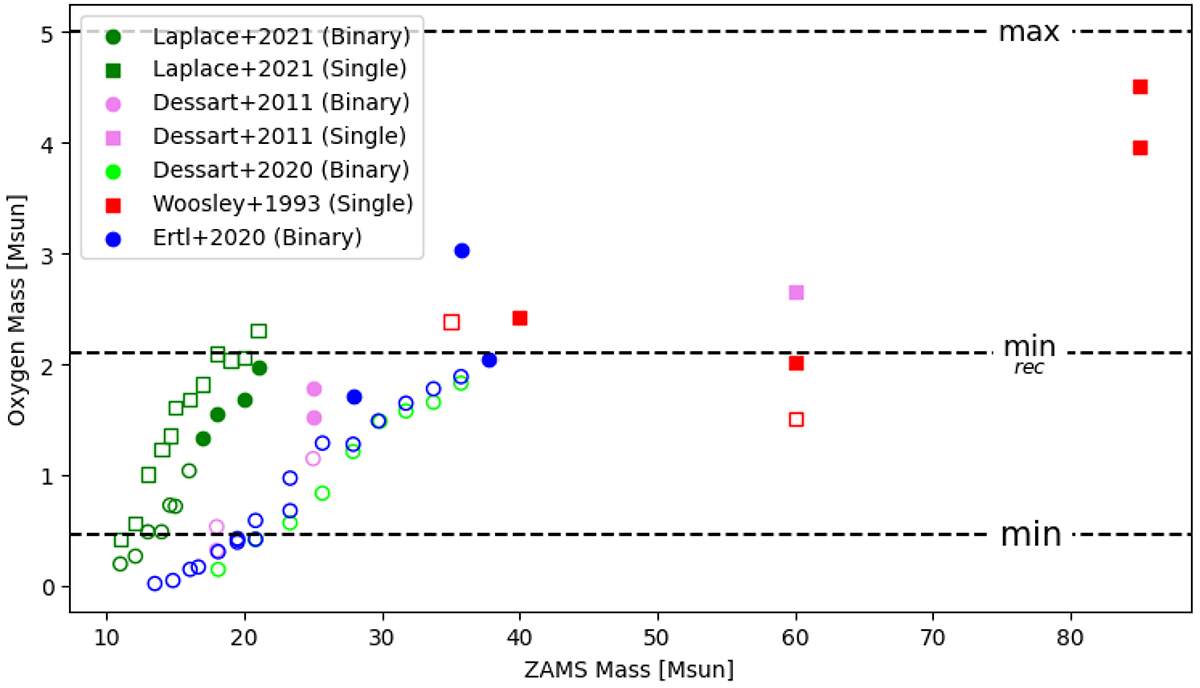
Relation between the supernova ejecta oxygen yield and the ZAMS mass of different stellar evolution and supernova explosion models. The lower dashed line denotes the constraint-free lower limit on the oxygen mass (Eq. (22)), while the upper dashed line denotes the minimum oxygen mass assuming the NLTE conditions derived from the recombination line analysis (Eq. (24)). Binary evolution models are shown using circles and single massive star models are denoted by square markers. Models inconsistent with the estimated ejecta mass or not fully stripped of hydrogen are shown using unfilled symbols.
Current usage metrics show cumulative count of Article Views (full-text article views including HTML views, PDF and ePub downloads, according to the available data) and Abstracts Views on Vision4Press platform.
Data correspond to usage on the plateform after 2015. The current usage metrics is available 48-96 hours after online publication and is updated daily on week days.
Initial download of the metrics may take a while.