Fig. 13.
Download original image
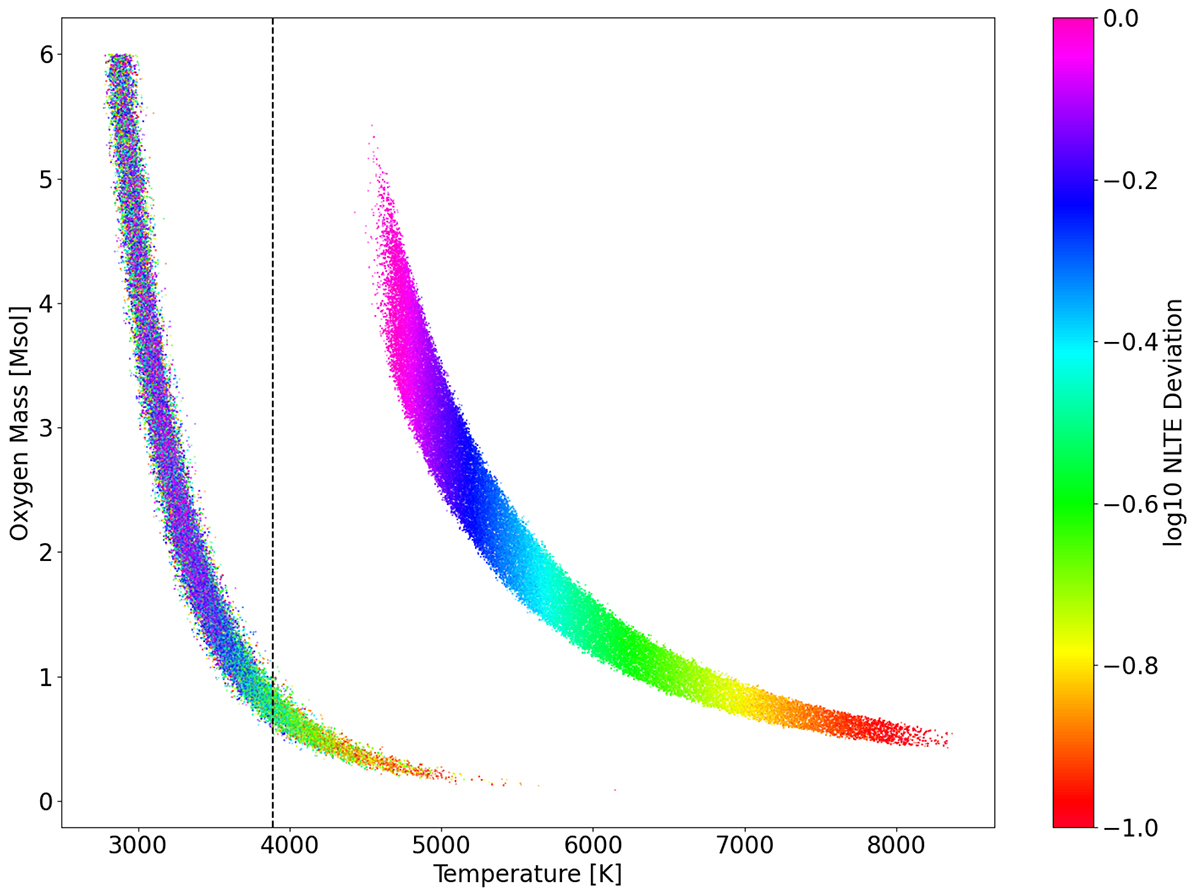
Scatter plot of the marginalised posterior distribution showing the oxygen mass as a function of the temperature for the last two observed spectra (the left-most trace corresponds to the very late time spectrum at +348 d). The colour denotes the LTE departure coefficient. The estimated value range for the LTE departure coefficient from the O I λ 7774 recombination line (Sect. C.1) is marked in the colour bar. One can see that the earlier spectrum provides a lower mass constraint, while the late one does not.
Current usage metrics show cumulative count of Article Views (full-text article views including HTML views, PDF and ePub downloads, according to the available data) and Abstracts Views on Vision4Press platform.
Data correspond to usage on the plateform after 2015. The current usage metrics is available 48-96 hours after online publication and is updated daily on week days.
Initial download of the metrics may take a while.