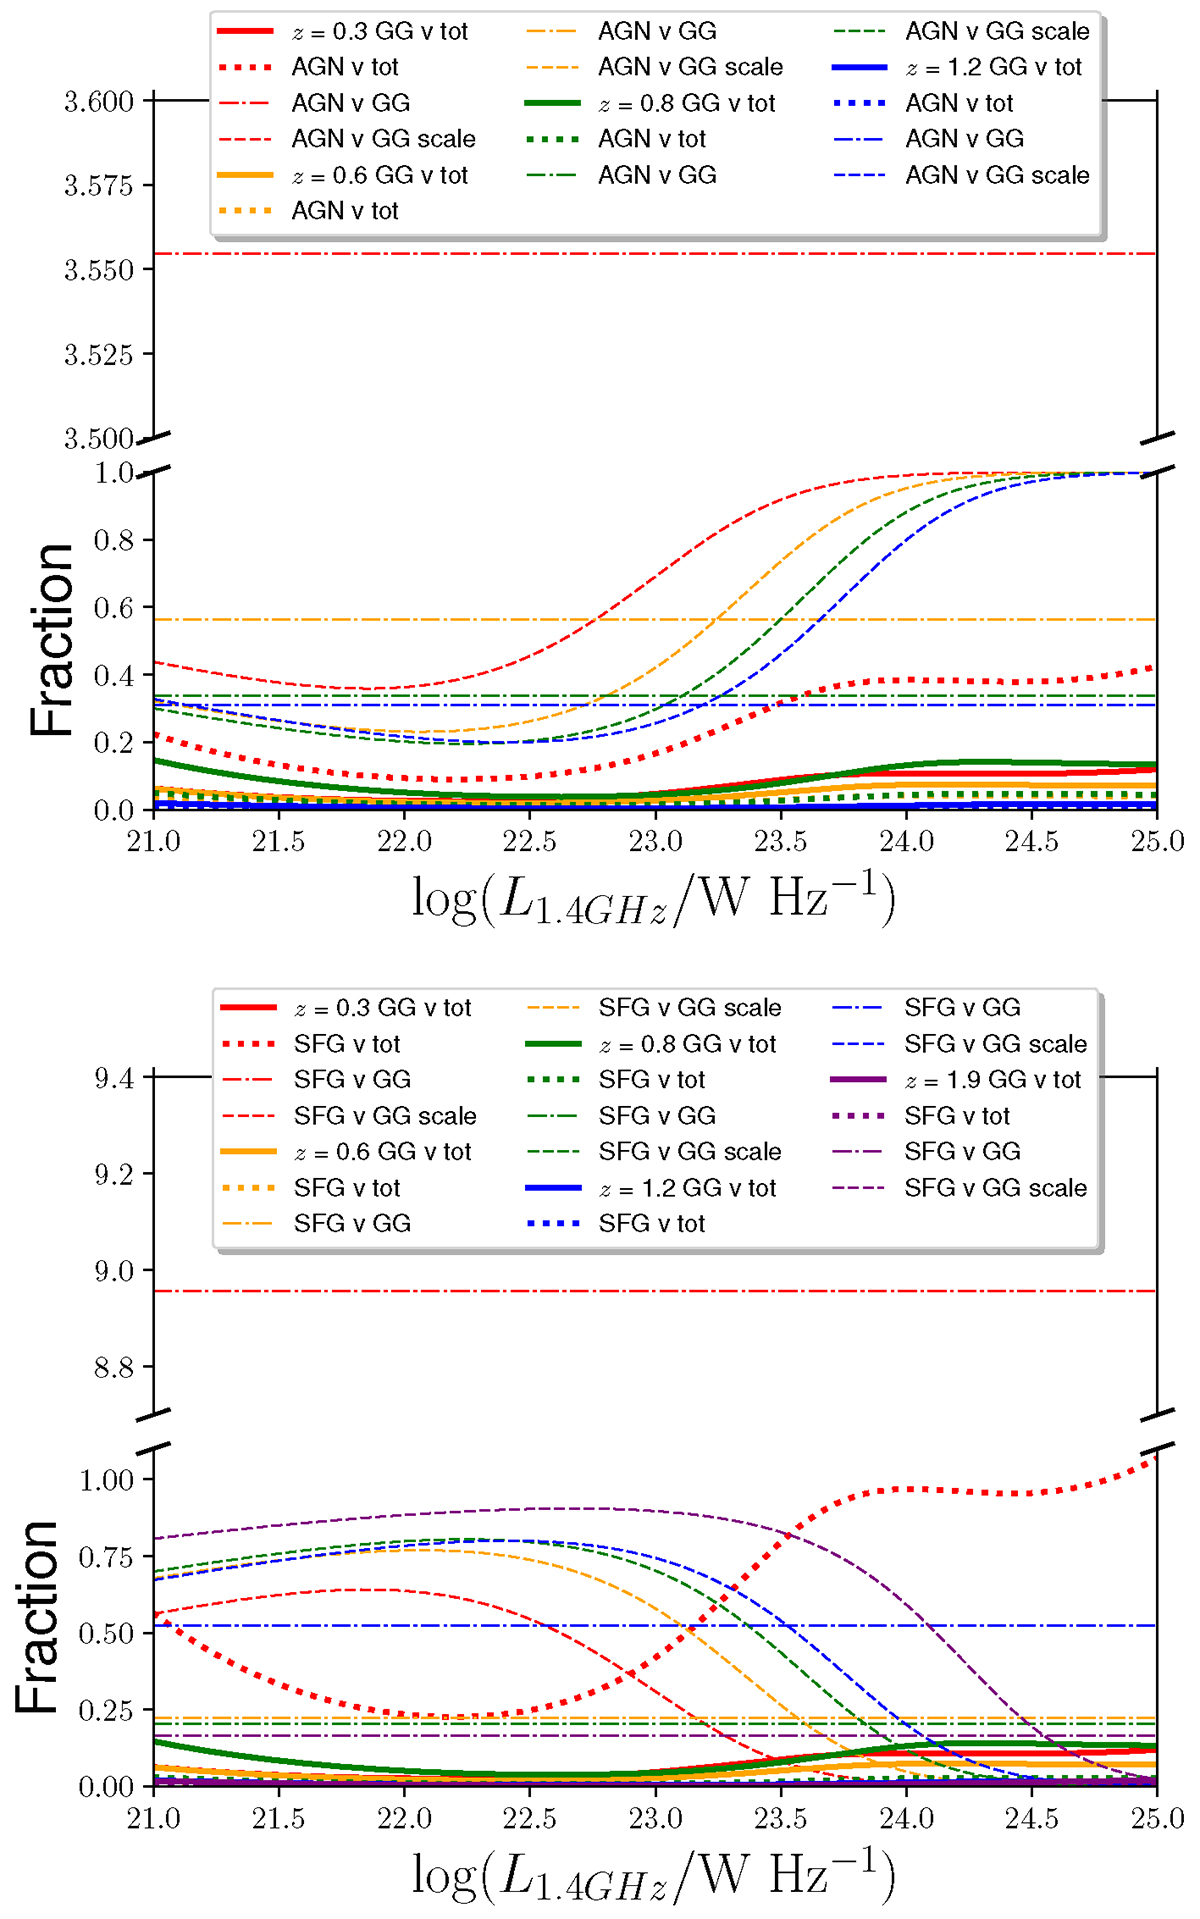
Fig. 8.
Download original image
Fractional contribution to total radio luminosity function at different epochs versus radio luminosity at 1.4 GHz for GGs (solid lines as in Fig. 5) and for different populations (dotted lines): AGN (top; labelled AGN v tot) and SFGs (bottom; labelled SFG v tot). Dotted-dashed lines show the fractional contribution of an AGN (labelled AGN v GG) and SFG (labelled SFG v GG) to the GG RLF. For reference, we plot the fraction of scaled AGN RLF (top) and scaled SFG RLF (bottom) to scaled GG RLF with dashed lines. Different colours represent different redshift bins as in Fig. 5. A halo mass cut of M200c > 1013.5 M⊙ was applied.
Current usage metrics show cumulative count of Article Views (full-text article views including HTML views, PDF and ePub downloads, according to the available data) and Abstracts Views on Vision4Press platform.
Data correspond to usage on the plateform after 2015. The current usage metrics is available 48-96 hours after online publication and is updated daily on week days.
Initial download of the metrics may take a while.