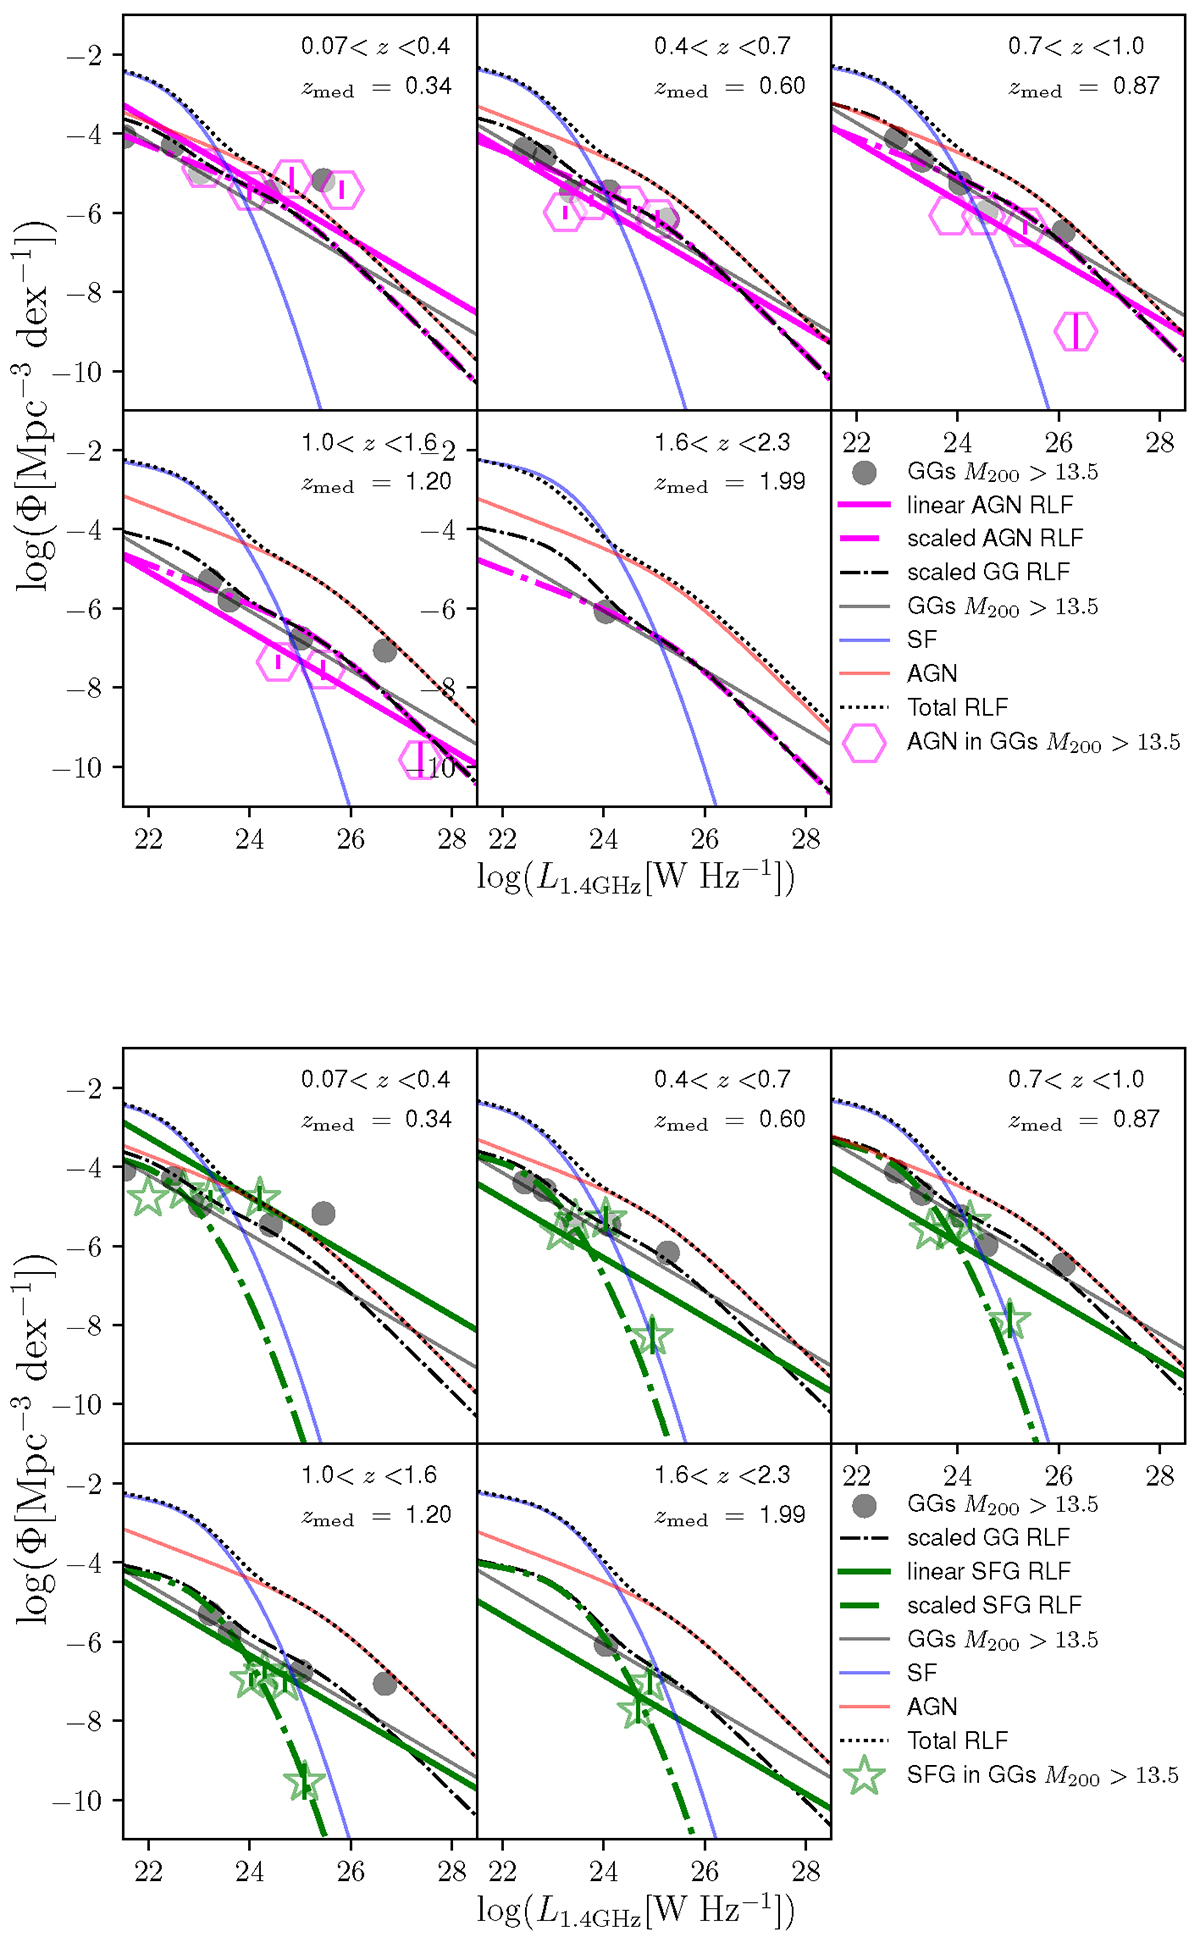
Fig. 7.
Download original image
Total radio luminosity functions of galaxies in groups, as in Figs. 2 and 3, including RLFs for different populations: radio AGN inside galaxy groups as magenta hexagons (top) and SFGs inside galaxy groups as green stars (bottom). To compare to the GG sample, we normalised the fit to the AGN and SFGs inside groups to L1.4 GHz = 1024 W Hz−1 and normalised a slope of γ = −0.75. For comparison, we show the GG sample (black circles for data, and a black solid line with a slope γ = −0.75 for the fit). We also plot the scaled AGN and SFG RLF (dashed-dotted lines), as reference. The red solid line shows the RLF for all AGN, the blue solid line shows it for all SFGs, and the dotted black line is the total RLF. A halo mass cut of M200c > 1013.5 M⊙ was applied. We note that the green solid line at the last bin of the SFG sample is forced to go though the two green stars.
Current usage metrics show cumulative count of Article Views (full-text article views including HTML views, PDF and ePub downloads, according to the available data) and Abstracts Views on Vision4Press platform.
Data correspond to usage on the plateform after 2015. The current usage metrics is available 48-96 hours after online publication and is updated daily on week days.
Initial download of the metrics may take a while.