Fig. 6.
Download original image
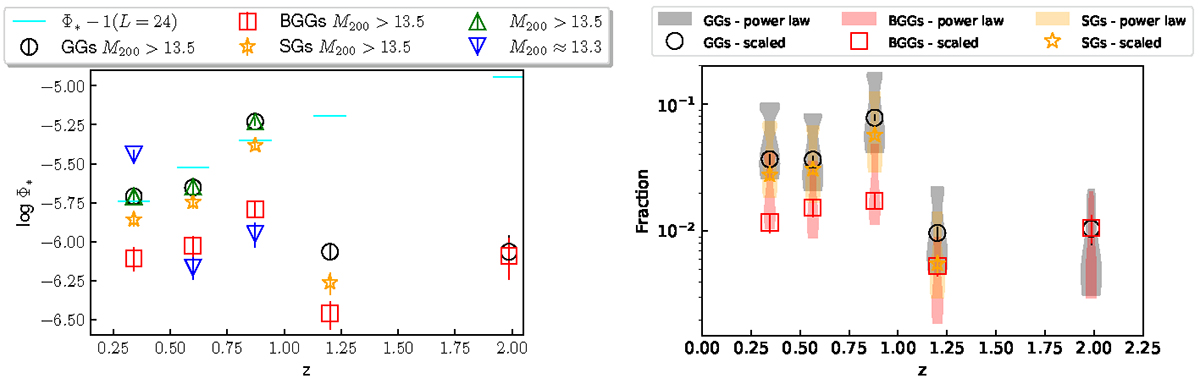
Left: Radio luminosity function versus redshift for the group galaxies (black circles), brightest group galaxies BGGs (red squares), and satellite galaxies SGs (yellow stars). Cyan lines show the Φ* values at log![]() for each redshift bin; these values were placed one dex lower for presentation reasons. The values plotted here are reported in Table A.5 for γ = −0.75. Right: Relative contribution of GGs to total radio luminosity, as described in Sect. 3.3.1 for the scaled fit (open symbols) and in Sect. 3.3.2 for the power-law, linear-regression fit (violin plots) versus redshift. The values in the violin plots show the distribution of fractions along our adopted luminosity range. Black circles denote GGs, red squares denote BGGs, and yellow stars denote SGs. A halo mass cut, log10(M200c/M⊙) > 13.5, was applied.
for each redshift bin; these values were placed one dex lower for presentation reasons. The values plotted here are reported in Table A.5 for γ = −0.75. Right: Relative contribution of GGs to total radio luminosity, as described in Sect. 3.3.1 for the scaled fit (open symbols) and in Sect. 3.3.2 for the power-law, linear-regression fit (violin plots) versus redshift. The values in the violin plots show the distribution of fractions along our adopted luminosity range. Black circles denote GGs, red squares denote BGGs, and yellow stars denote SGs. A halo mass cut, log10(M200c/M⊙) > 13.5, was applied.
Current usage metrics show cumulative count of Article Views (full-text article views including HTML views, PDF and ePub downloads, according to the available data) and Abstracts Views on Vision4Press platform.
Data correspond to usage on the plateform after 2015. The current usage metrics is available 48-96 hours after online publication and is updated daily on week days.
Initial download of the metrics may take a while.