Fig. 5.
Download original image
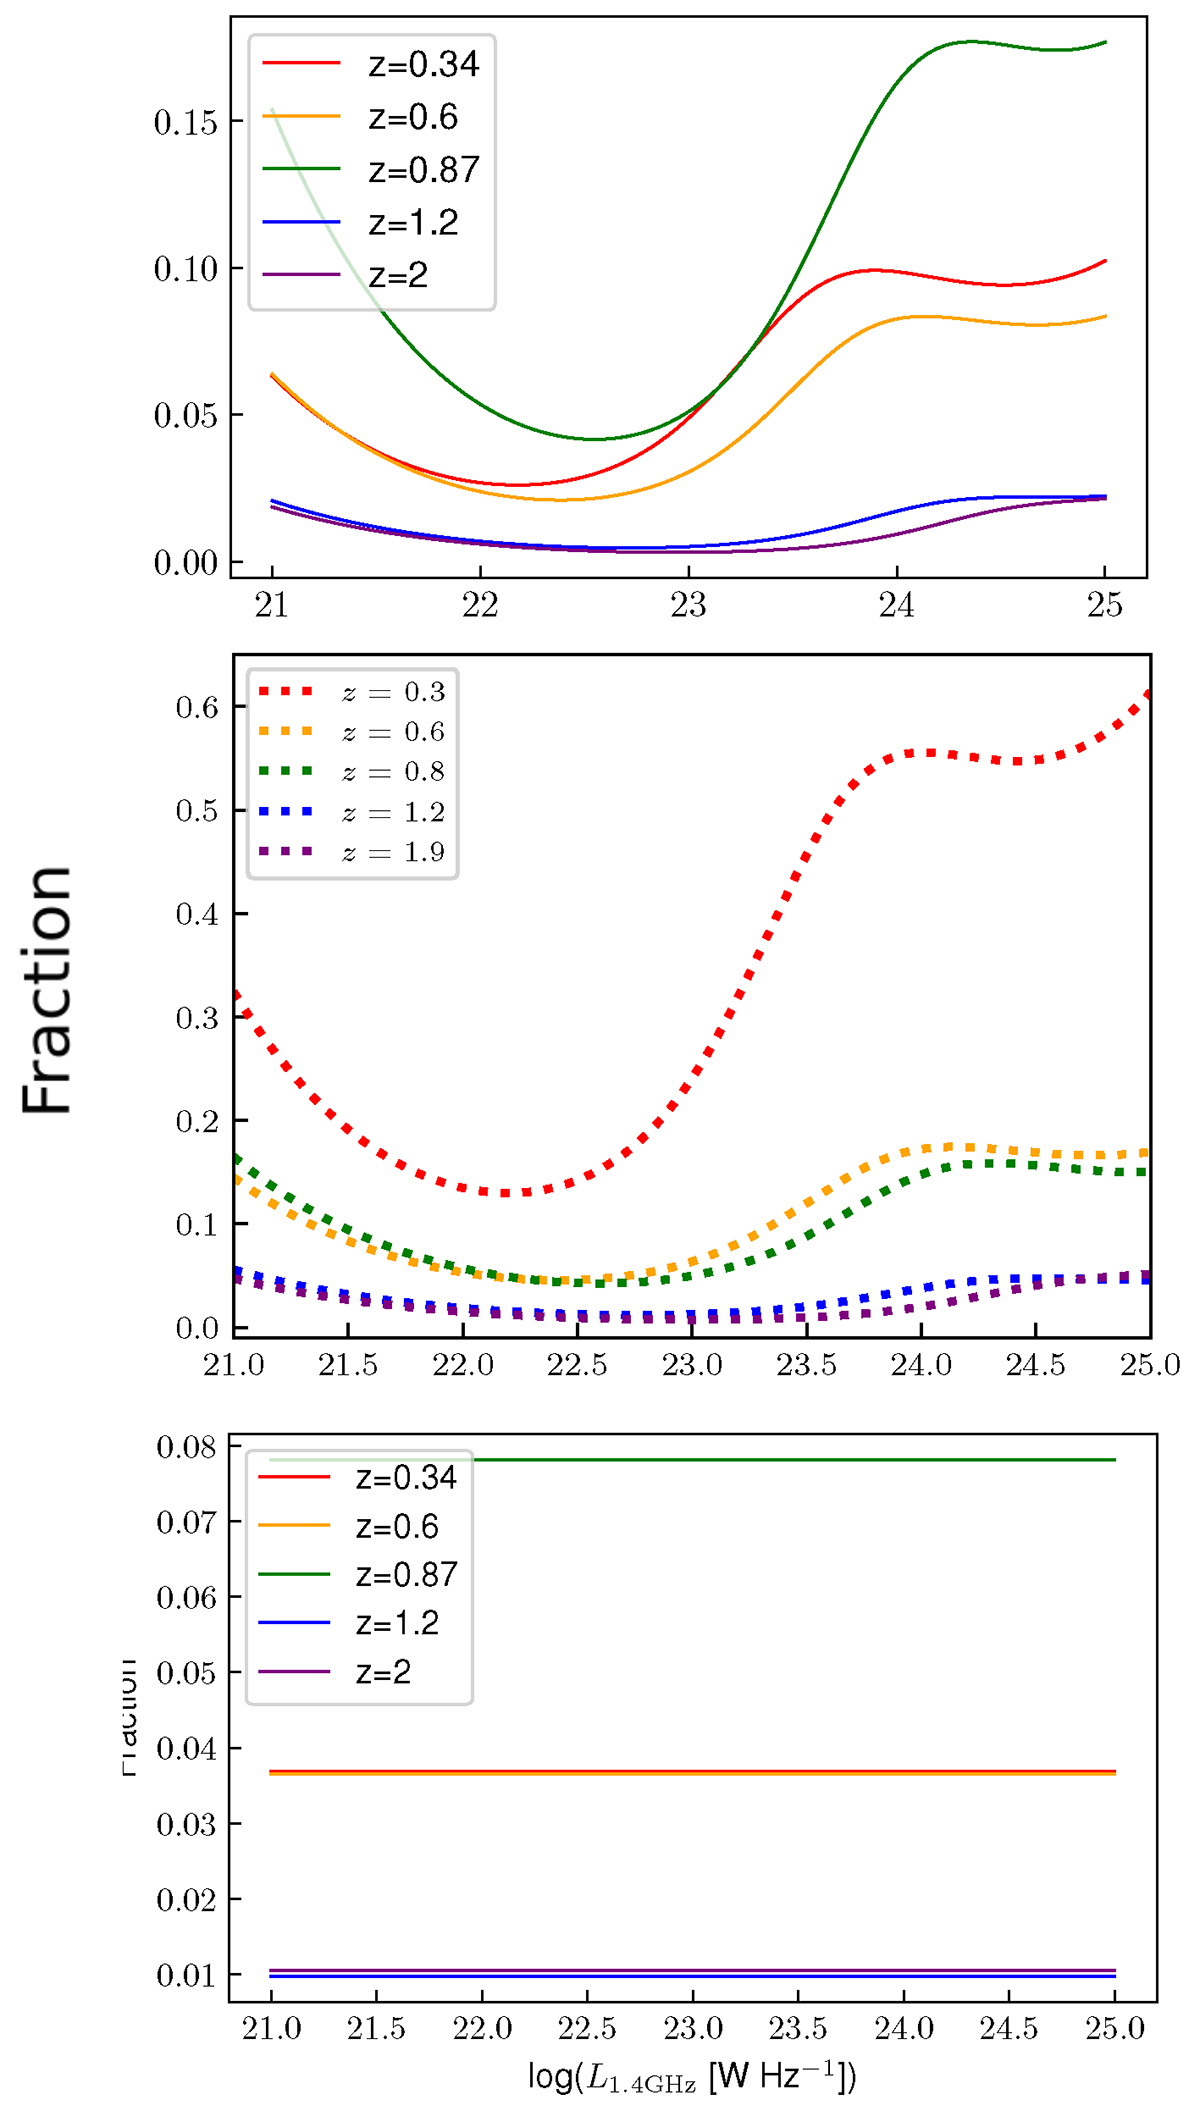
Top: Fraction for group galaxies showing their contribution to the total 3 GHz radio-luminosity function at different epochs using the power-law, linear-regression fit method presented in Sect. 3.3.2 versus radio luminosity at 1.4 GHz. Colours represent different redshift bins. Middle: Same as above, but for all massive galaxies (M* > 1011.2 M⊙) with radio emission at 3 GHz (Smolčić et al. 2017b; Laigle et al. 2016). Bottom: Fraction using scaled fit method presented in Sect. 3.3.1. A halo mass cut above 1013.5 M⊙ was applied to all plots.
Current usage metrics show cumulative count of Article Views (full-text article views including HTML views, PDF and ePub downloads, according to the available data) and Abstracts Views on Vision4Press platform.
Data correspond to usage on the plateform after 2015. The current usage metrics is available 48-96 hours after online publication and is updated daily on week days.
Initial download of the metrics may take a while.