Open Access
Fig. 4.
Download original image
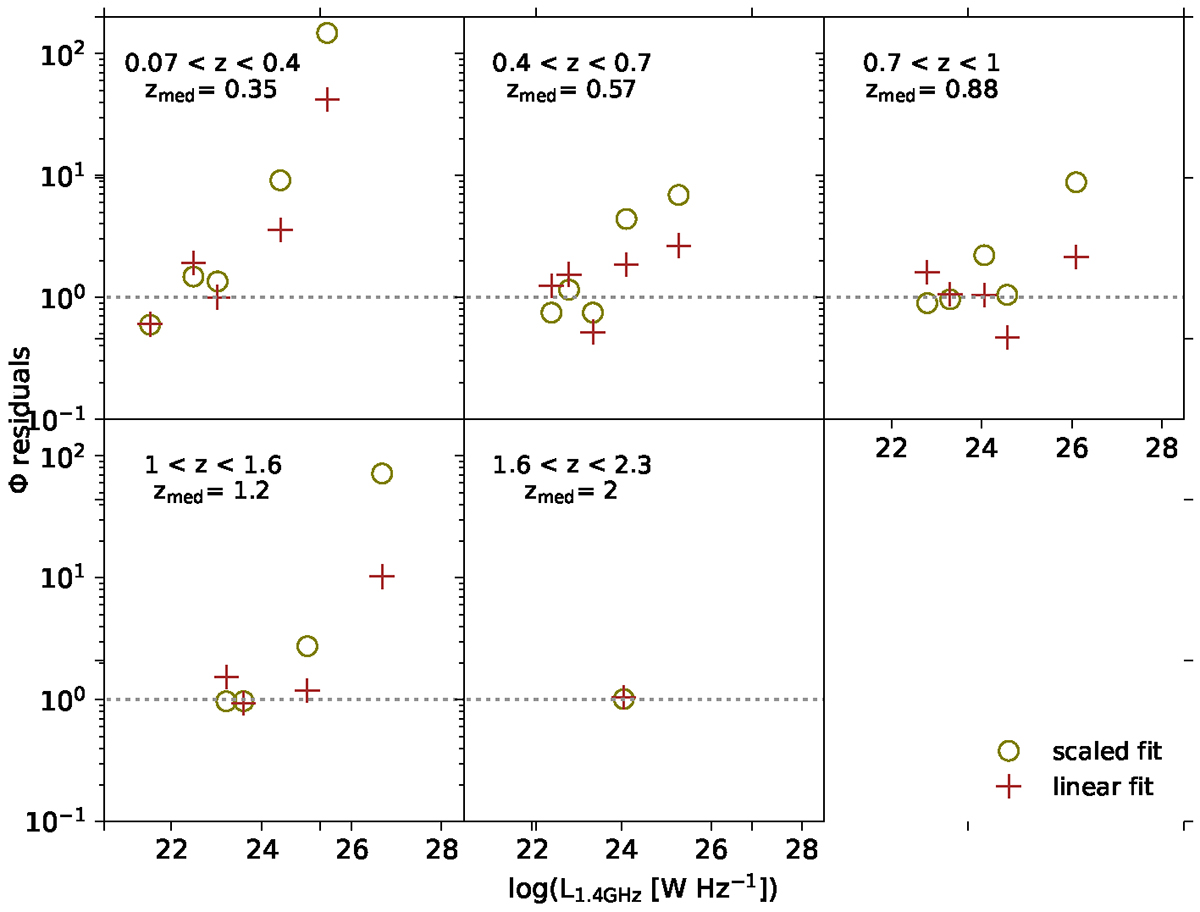
Ratio of Φ GG RLF data points in adopted luminosity range and in each redshift bin, and the corresponding model value. Open olive circles denote the scaled fit method (Sect. 3.3.1) and brown crosses denote the linear-regression fit method (Sect. 3.3.2). The dotted gray line shows a perfect agreement between data and model.
Current usage metrics show cumulative count of Article Views (full-text article views including HTML views, PDF and ePub downloads, according to the available data) and Abstracts Views on Vision4Press platform.
Data correspond to usage on the plateform after 2015. The current usage metrics is available 48-96 hours after online publication and is updated daily on week days.
Initial download of the metrics may take a while.