Fig. 3.
Download original image
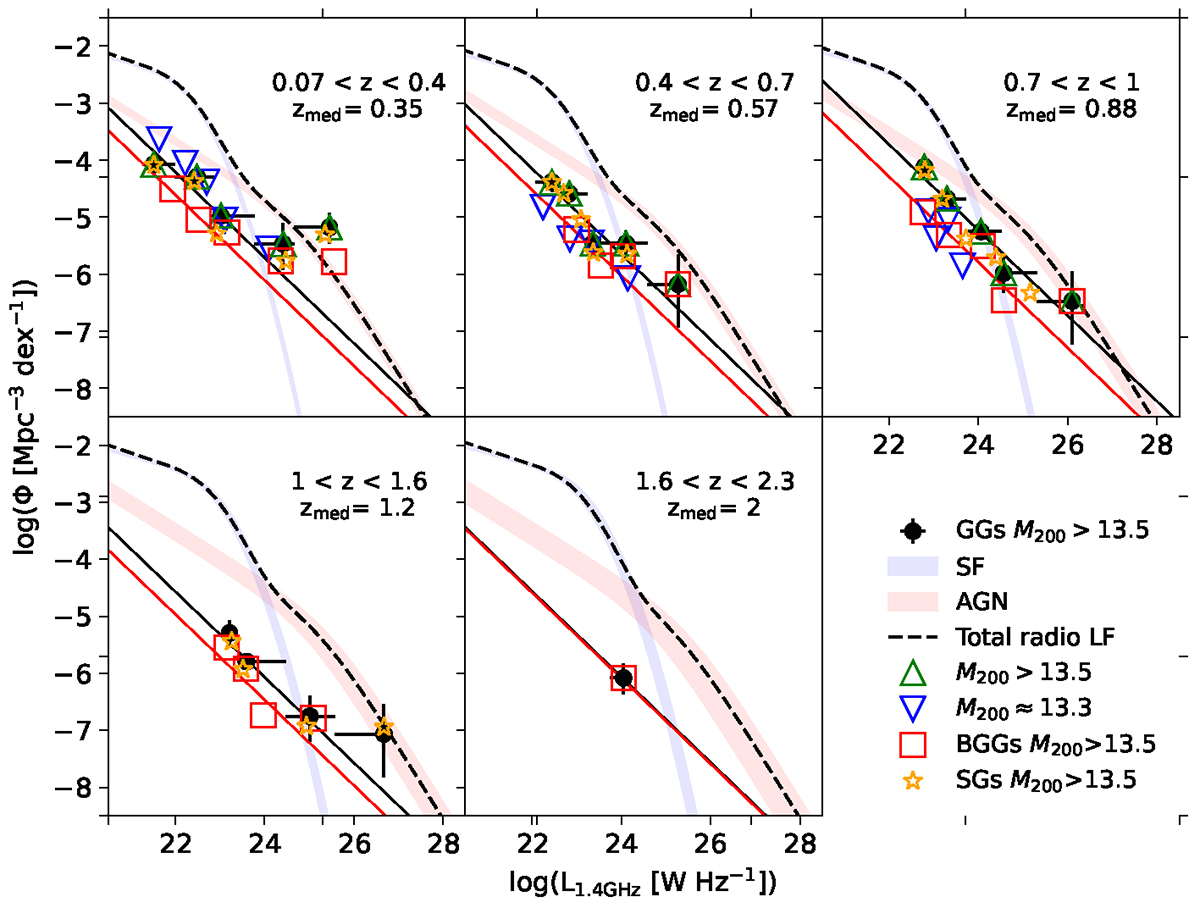
Same as Fig. 2, but for the power-law fit. Total radio luminosity functions of galaxies in groups. Black points indicate the RLFs for GGs derived using the Vmax method (see Section 3.1). Red squares and yellow stars mark the brightest GGs and satellites, respectively. The blue and red shaded areas show the ±3σ ranges of the best-fit evolution for the individual SFG and AGN populations, respectively (outlined in Section 3.2). The black dashed line is the fit to the total RLF at 3 GHz VLA-COSMOS (Novak et al. 2017; Smolčić et al. 2017c). For the z < 1 subsamples (z < 0.4), the halos have been split into massive (M200c > 1013.5 M⊙) and low-mass halos (M200c ≈ 1013.3 M⊙); the latter are shown for completion but not used in the analysis. For the rest of the redshift bins, all samples have M200c > 1013.5 M⊙. A halo mass cut, M200c > 1013.5 M⊙, was applied to the GGs, BGGs, and SGs. The black solid line is the fit to the GGs’ RLF, and the red solid line is the best fit for BGGs, as explained in Section 3.3.2. We do not show the best fit for SGs for clarity. The black line for the linear regression fit for GGs in the last redshift bin is hidden by the red line for BGGs, because there are no SGs in that bin.
Current usage metrics show cumulative count of Article Views (full-text article views including HTML views, PDF and ePub downloads, according to the available data) and Abstracts Views on Vision4Press platform.
Data correspond to usage on the plateform after 2015. The current usage metrics is available 48-96 hours after online publication and is updated daily on week days.
Initial download of the metrics may take a while.