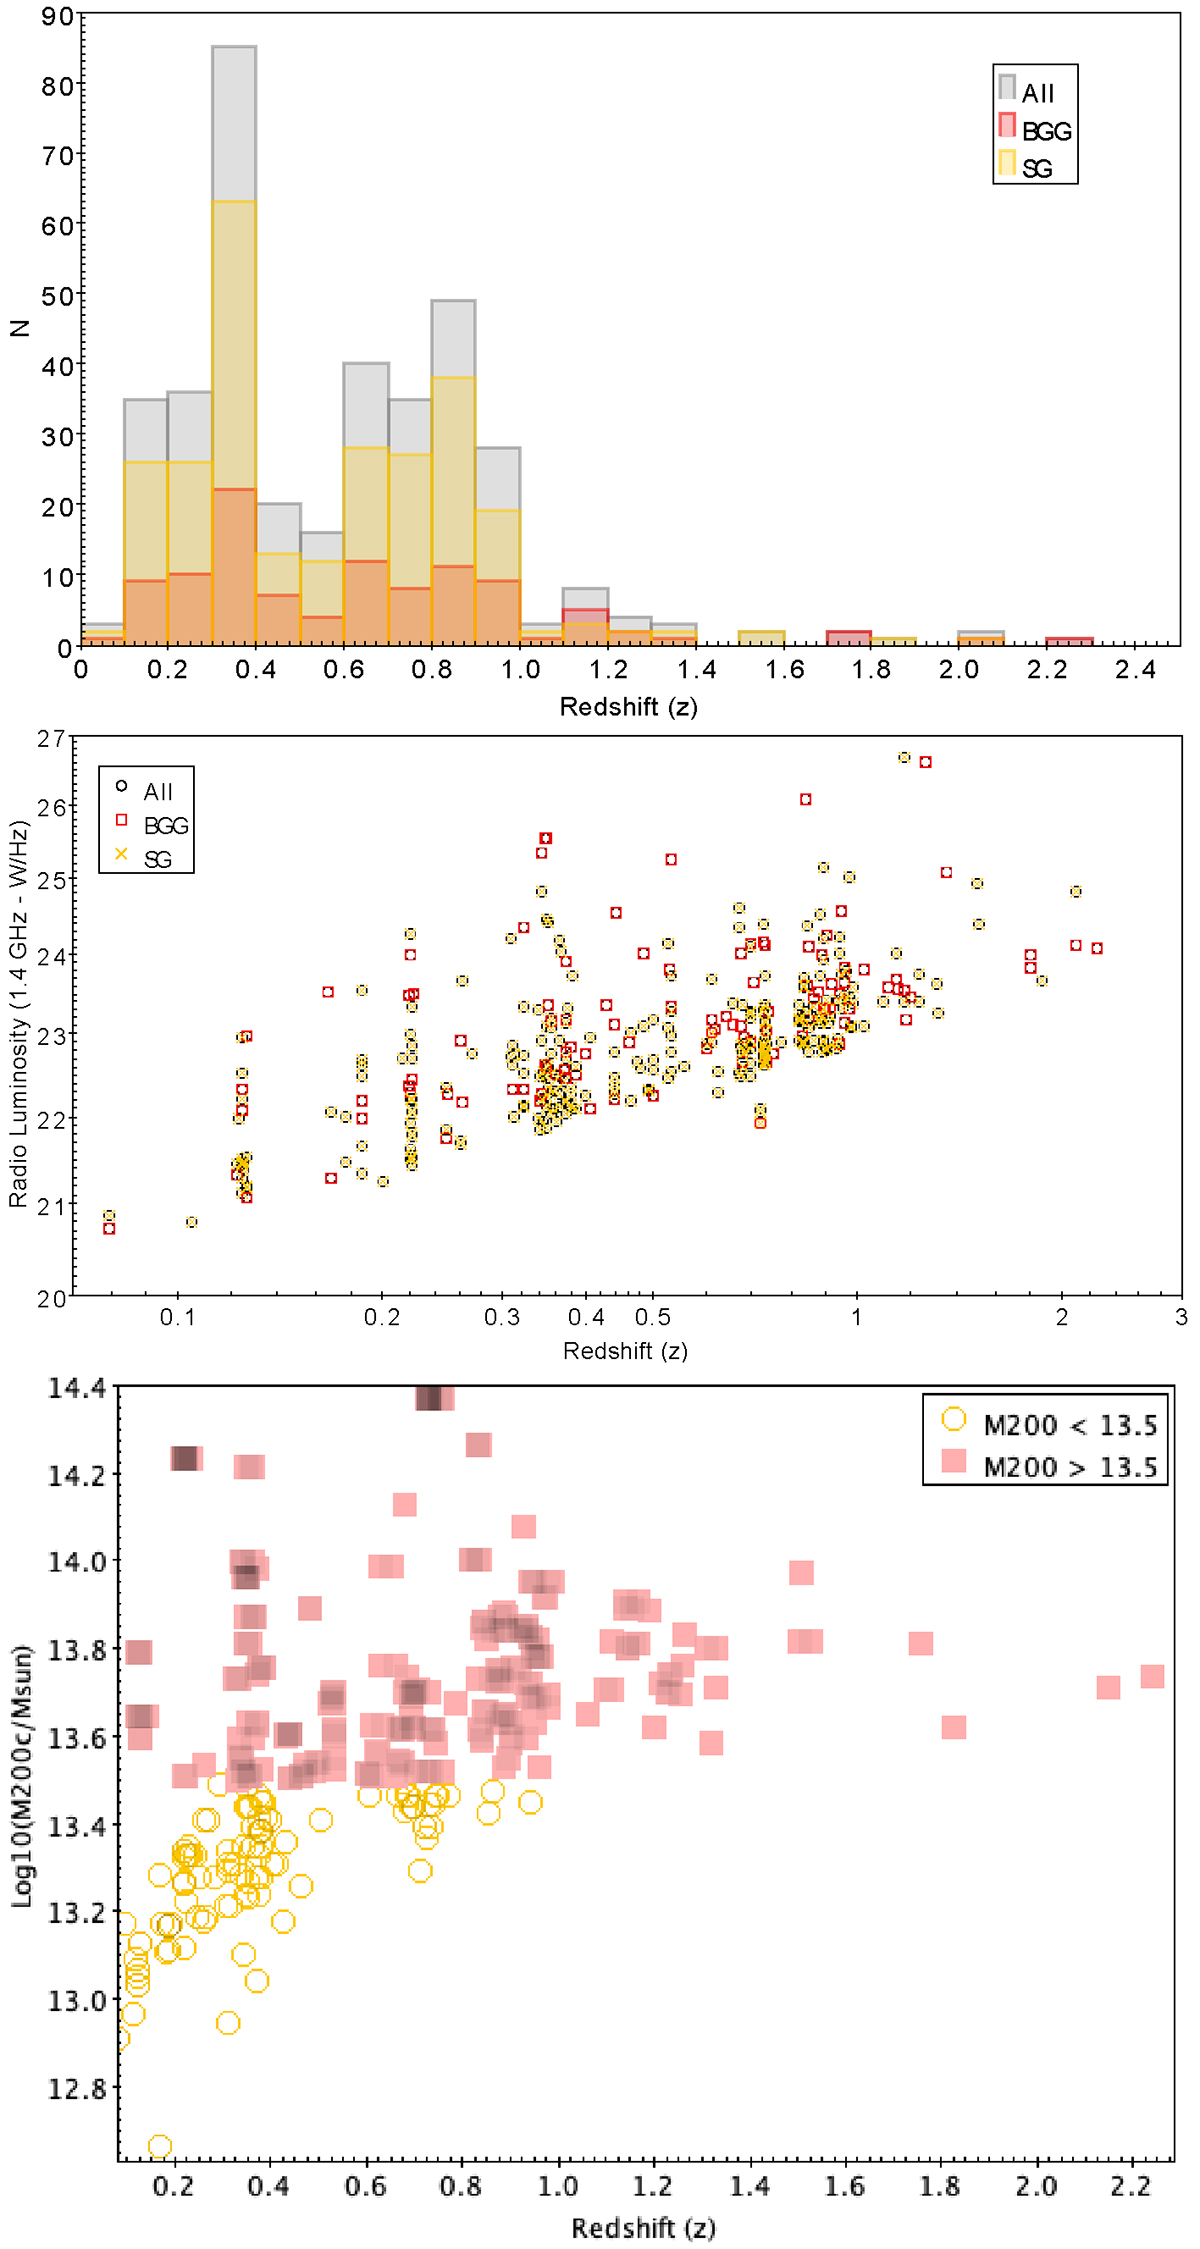
Fig. 1.
Download original image
Top: Number of sources per redshift. The bin size is 0.1. Middle: Radio luminosity at 1.4 GHz versus redshift. The redshift plotted is that of the galaxy groups. The radio luminosity is calculated from the 1.4 GHz flux density for the redshift of the object. Black represents all group galaxies, red is for BGGs, and yellow is for SGs (see Sect. 2 for clarification on the classification). Bottom: Halo mass versus redshift. Pink filled squares denote log10(M200/M⊙) > 13.5 and yellow open circles log10(M200/M⊙) < 13.5, which we refer to as log10(M200/M⊙)≈13.3 in the rest of the paper. The divide shows our adopted halo mass cut to account for sample completeness (Sect. 2.2).
Current usage metrics show cumulative count of Article Views (full-text article views including HTML views, PDF and ePub downloads, according to the available data) and Abstracts Views on Vision4Press platform.
Data correspond to usage on the plateform after 2015. The current usage metrics is available 48-96 hours after online publication and is updated daily on week days.
Initial download of the metrics may take a while.