Open Access
Fig. 2.
Download original image
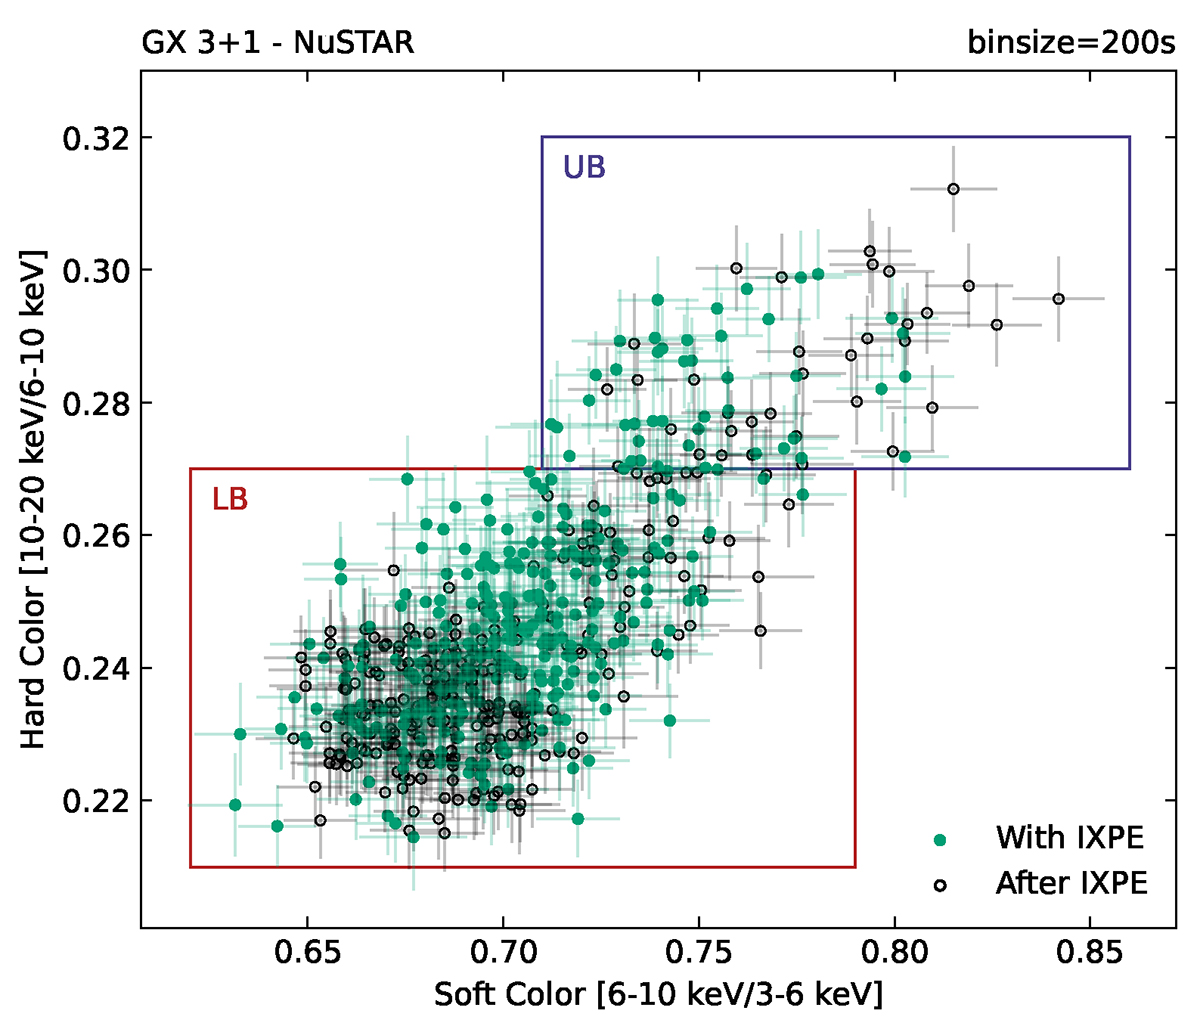
NuSTAR CCD of GX 3+1. The soft and hard colors are defined as the ratio of the counts in the 6–10/3–6 keV and 10–20/6–10 keV bands, respectively. Empty black circles denote the NuSTAR points not simultaneous with IXPE observation. The red and purple boxes correspond to the LB and UB region. Each bin corresponds to 200 s.
Current usage metrics show cumulative count of Article Views (full-text article views including HTML views, PDF and ePub downloads, according to the available data) and Abstracts Views on Vision4Press platform.
Data correspond to usage on the plateform after 2015. The current usage metrics is available 48-96 hours after online publication and is updated daily on week days.
Initial download of the metrics may take a while.