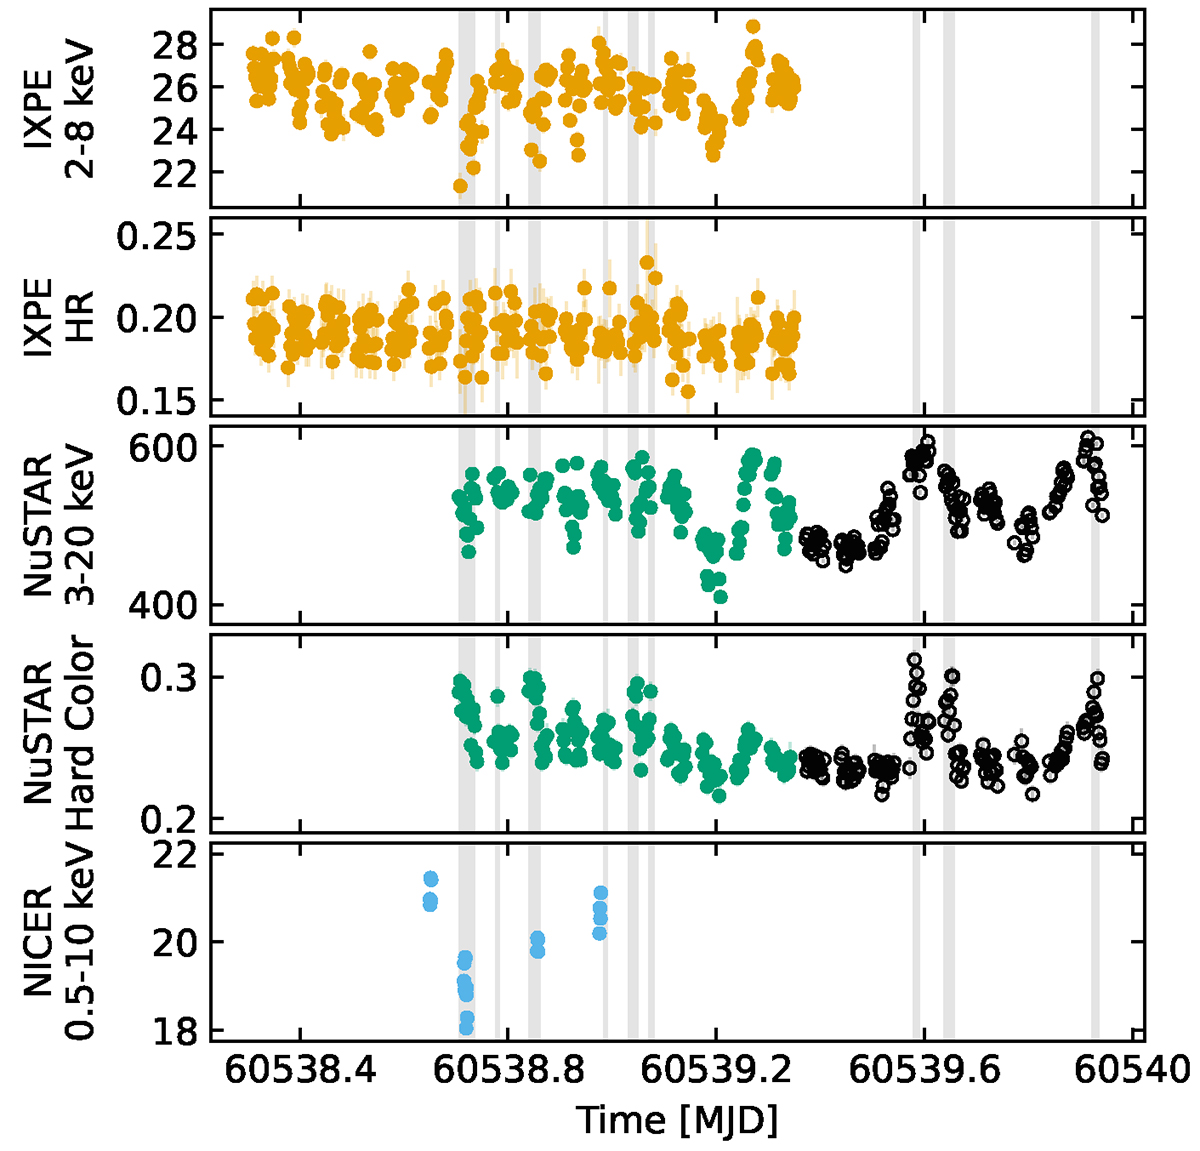
Fig. 1.
Download original image
IXPE, NuSTAR, and NICER light curves of GX 3+1 (count s−1). The second panel shows the IXPE hardness ratio (5–8 keV/3–5 keV). The fourth panel shows the NuSTAR hard color (10–20 keV/6–10 keV). Empty black circles denote the NuSTAR points that are not simultaneous with the IXPE observation. The gray regions correspond to the time intervals during which the source moves in the UB branch. For IXPE and NuSTAR, we considered time bins of 200 s, whereas for NICER we opted for 50 s bins.
Current usage metrics show cumulative count of Article Views (full-text article views including HTML views, PDF and ePub downloads, according to the available data) and Abstracts Views on Vision4Press platform.
Data correspond to usage on the plateform after 2015. The current usage metrics is available 48-96 hours after online publication and is updated daily on week days.
Initial download of the metrics may take a while.