| Issue |
A&A
Volume 692, December 2024
|
|
|---|---|---|
| Article Number | L10 | |
| Number of page(s) | 5 | |
| Section | Letters to the Editor | |
| DOI | https://doi.org/10.1051/0004-6361/202452595 | |
| Published online | 17 December 2024 | |
Letter to the Editor
Large-scale stellar age-velocity spiral pattern in NGC 4030
1
Dep. of Astrophysics, University of Vienna, Türkenschanzstraße 17, 1180 Vienna, Austria
2
Instituto de Astrofísica de Canarias, Calle Vía Láctea s/n, E-38205 La Laguna, Tenerife, Spain
3
Dep. de Astrofísica, Universidad de La Laguna, Av. del Astrofísico Francisco Sánchez s/n, E-38206 La Laguna, Tenerife, Spain
4
Centre for Extragalactic Astronomy, Department of Physics, Durham University, South Road, Durham DH1 3LE, UK
5
Graduate Institute for Advanced Studies, SOKENDAI, 2-21-1 Osawa, Mitaka, Tokyo 181-8588, Japan
6
Subaru Telescope, National Astronomical Observatory of Japan, 650 N Aohoku Pl, Hilo, HI 96720, Japan
7
Leibniz-Institut für Astrophysik Potsdam (AIP), An der Sternwarte 16, 14482 Potsdam, Germany
8
Dep. de Física e Astronomia, Faculdade de Ciências, Rua do Campo Alegre, 4169-007 Porto, Portugal
9
Leiden Observatory, Leiden University, PO Box 9513 2300 RA Leiden, The Netherlands
⋆ Corresponding author; This email address is being protected from spambots. You need JavaScript enabled to view it.
Received:
12
October
2024
Accepted:
25
November
2024
Abstract
The processes driving the formation and evolution of late-type galaxies continue to be a debated subject in extragalactic astronomy. Investigating stellar kinematics, especially when combined with age estimates, provides crucial insights into the formation and subsequent development of galactic discs. Post-processing of exceptionally high-quality integral field spectroscopy data of NGC 4030 acquired with the Multi Unit Spectroscopic Explorer (MUSE) has revealed a striking grand design spiral pattern in the velocity dispersion map, that has not been detected in other galaxies. This pattern spatially correlates with HII regions, suggesting that stars currently being born exhibit lower velocity dispersion as compared to surrounding areas where star-formation is less active. We examined the age-velocity relation (AVR) and propose that its configuration might be shaped by a combination of heating mechanisms, seemingly consistent with findings from recent high-resolution cosmological zoom-in simulations. The complex structure of the uncovered AVR of NGC 4030 supports the hypothesis that stellar populations initially inherit the velocity dispersion σ of the progenitor cold molecular gas, which depends on formation time and galactocentric distance, subsequently experiencing kinematic heating due to cumulative gravitational interactions during their lifetime. While advancing our understanding of the AVR, these findings also offer a new framework for investigating disc heating mechanisms and their role in the evolution of galactic discs.
Key words: galaxies: kinematics and dynamics / galaxies: spiral / galaxies: stellar content / galaxies: structure
© The Authors 2024
 Open Access article, published by EDP Sciences, under the terms of the Creative Commons Attribution License (https://creativecommons.org/licenses/by/4.0), which permits unrestricted use, distribution, and reproduction in any medium, provided the original work is properly cited.
This article is published in open access under the Subscribe to Open model. This email address is being protected from spambots. You need JavaScript enabled to view it. to support open access publication.
1. Introduction
Observations of individual stars in the solar vicinity show a clear trend of increasing stellar velocity dispersion (σ⋆) with stellar age (τ⋆), demonstrating that older stars are typically kinematically hotter (e.g. Casagrande et al. 2011), whereas younger stars tend to be kinematically cooler (e.g. Aumer & Binney 2009). This is known as the stellar age-velocity relation (AVR), being a well-established phenomenon in Galactic dynamics, though its origin remains highly debated. The AVR is frequently attributed to secular kinematical heating mechanisms reflecting the cumulative effect of gravitational inter actions by giant molecular clouds (GMCs; Spitzer & Schwarzschild 1951, 1953; Kokubo & Ida 1992), stellar populations in the bar (Dehnen 2000; Minchev & Famaey 2010), spiral arms (Barbanis & Woltjer 1967; Goldreich & Tremaine 1980; De Simone et al. 2004), halo black holes (Hänninen & Flynn 2002), MAssive Compact Halo Objects (MACHOs; Lacey & Ostriker 1985; Binney & Tremaine 2008), and minor mergers (Quinn et al. 1993; Walker et al. 1996; Huang & Carlberg 1997). Other authors, however, have invoked an alternative explanation: Spatially resolved observations of high redshift galaxies have revealed that disc galaxies at these epochs tend to exhibit more turbulent interstellar media (ISMs), as compared to local galaxies (e.g. Förster 2009; Genzel et al. 2011; Kassin et al. 2012; Stott et al. 2016). Therefore, by assuming that stars inherit the kinematic imprints of their progenitor gas cloud, the AVR might simply reflect the gradual settlement of the gas in the disc. In other words, older stellar populations born from more turbulent ISMs, inherit a higher σ⋆ as compared to younger stellar populations that formed when the ISM was less turbulent.
In our own Galaxy, the AVR offers crucial insights into the processes shaping the dynamical evolution of the stellar disc. However, different studies have reported various configurations of the Milky Way’s (MW) AVR. Frequently, the AVR is modelled as a smooth power law indicating continuous heating. This approach offers theoretical predictions on the evolution of σ⋆ (both radial and vertical) over time (σ⋆ ∝ τ⋆x), with values of x ranging from 0.2 to 0.6 (see Kumamoto et al. 2017; Fatheddin & Sajadian 2023, for details). In contrast, other authors argue that σ⋆ increases sharply for stars up to 5 Gyr old and then plateaus, suggesting saturation of the heating mechanism (Carlberg & Sellwood 1985; Gómez et al. 1997). In addition, a third model postulates that dispersion changes in discrete age groups (younger than 3 Gyr, 3−10 Gyr, and older than 10 Gyr) without a smooth age correlation, possibly due to events such as mergers affecting older stars (Freeman 1991; Quillen & Garnett 2001).
There are several works attempting to reproduce the MW’s AVR via models and/or simulations, employing a variety of theoretical frameworks and computational techniques. While these works have significantly advanced our knowledge of the mechanisms causing the observed AVR, their outcomes can differ substantially and may sometimes be contradictory. A recurrent result is that the stellar velocity dispersion depends on the combination of the initial velocity dispersion of the gas, which is determined by the turbulence of the ISM, and the subsequent gradual heating due to interactions with the aforementioned perturbative agents. For instance, by employing smoothed particle hydrodynamic simulations of self-gravitating multiphase gas discs in static disc-halo potentials, Kumamoto et al. (2017) found that the evolution of the stellar velocity dispersion is determined by the initial velocity dispersion and the heating rate. A similar conclusion was reached through models based on observed star-formation histories of Local Group (LG) galaxies, such as the ones by Leaman et al. (2017), where they adopt an evolutionary formalism to describe the ISM velocity dispersion influenced by the galaxy’s evolving gas fraction. Their results suggest that stars are born with a velocity dispersion similar to that of the gas at their formation, with dynamical heating occurring with galaxy mass-dependent efficiency. Alternative interpretations have been proposed, such as those by van Donkelaar et al. (2022), who suggest that the orbital eccentricities in the MW disc may stem solely from the characteristics of the preceding ISM, and by Aumer et al. (2016), whose N-body simulations indicate that gradual heating from GMCs and spiral/bar interactions may fully account for the MW’s AVR.
Interesting insights have emerged from cosmological zoom-in simulations, offering a detailed exploration of the intricate interplay between gravitational forces, gas dynamics, and stellar evolution across cosmic scales. In this context, Martig et al. (2014a,b) simulated seven disc galaxies with stellar masses ranging from 4.3 to 12 × 1010 M⊙. They find that old stars exhibit a high σ⋆, as every galaxy experiences an initial phase of active mergers at high redshift, leading to the early formation of a thick stellar component characterised by a high velocity dispersion. For the quiescent galaxies, referring to those that do not undergo any major subsequent merger, they note a gradual rise in σ⋆ with age, suggesting that the slope of the AVR is not predetermined at birth but is a consequence of subsequent heating mechanisms. Moreover, they observed a significant sensitivity of σ⋆ to the merger history. Another noteworthy result is the one by Bird et al. (2021). By employing a high-resolution cosmological zoom-in simulation of an MW-mass disc galaxy (h277), these authors found excellent agreement between the present-day AVR of h277 and the AVR measured in the solar vicinity. They discovered that older stars are born kinematically hotter, supporting an ‘upside-down’ formation scenario, and are further heated after birth. Furthermore, the disc grows ‘inside-out’, as the angular momentum of accreted gas increases with decreasing redshift. Interestingly, although the vast majority of old stars (> 10 Gyr) are born in the interior of the disc, many can be currently found in the solar neighbourhood as a result of radial migration. As the velocity dispersion inherited at birth (σbirth) increases with lookback time and the outer disc remains dynamically colder than the inner disc, younger stellar populations are born at a larger galactocentric radii with a lower mean σbirth. Thereafter, subsequent heating due to encounters with perturbative agents accounts for approximately half of the present-day stellar velocity dispersion, σbirth/σ ∼ 0.4 − 0.5, with older (younger) stars displaying the lowest (highest) ratio. They also find a consistent agreement between the AVR measured for stars in the solar vicinity and the AVR across the entire disc.
Beyond the MW, the AVR has been studied in LG galaxies such as Andromeda (M31, Dorman et al. 2015) and other nearby systems (Leaman et al. 2017). In addition, Pessa et al. (2023) performed the first assessment of the AVR outside the LG. Analysis of 19 PHANGS-MUSE galaxies have revealed that while spiral arms and discs, which are associated with younger stellar populations, share similar σ⋆, galaxy centres and bars, typically populated by older stars, display higher σ⋆ populations. To correctly interpret these trends, the authors explore σ⋆ radial gradients for different stellar age bins, uncovering that younger stars predominantly display lower σ⋆. No significant differences were found between spiral arms and discs, suggesting that spiral arms do not play a primary role in stellar kinematic heating.
In this study, we interpret the stellar AVR of NGC 4030 through a detailed analysis of high-resolution integral-field spectroscopic data, following the unprecedented discovery of striking grand design spiral patterns in the σ⋆ map extending across the entire area probed by the MUSE datacube1. This spiral galaxy, at a distance of 29.9 Mpc, is morphologically classified as SA(s)bc, and it has an estimated total stellar mass of M⋆ = 1.5 × 10¹¹ M⊙, an estimated star-formation rate of 11.08 M⊙/yr, and an effective radius Reff of 31.8″ ∼4.6 kpc (Erroz-Ferrer et al. 2019).
2. Methodology
The spectroscopic data here analysed consists of integral field unit (IFU) data observed with the Multi Unit Spectroscopic Explorer (MUSE; Bacon et al. 2010) as part of the MUSE Atlas of Discs (MAD) survey (Erroz-Ferrer et al. 2019). The datacube, which probes the innermost part of the galaxy covering approximately its effective radius, was analysed utilising the pipeline comprehensively described in Breda et al. (in prep.). The data processing was initiated by correcting for Galactic extinction and de-redshifting, followed by Voronoi binning (adopting the method by Cappellari & Copin 2003), targeting at a signal-to-noise ratio of 170 in the (emission-line-free pseudo-continuum) spectral range between 6390 and 6490 Å. Stellar ages were derived via spectral synthesis using FADO (Gomes & Papaderos 2017) within the spectral range between 4730 and 8740 Å by employing the simple stellar population (SSP) library based on the Bruzual & Charlot (2003) models. This stellar library comprises 152 SSPs for 38 ages between 1 Myr and 13 Gyr for four stellar metallicities (0.05, 0.2, 0.4, and 1.0 Z⊙), referring to a Salpeter initial mass function (Salpeter 1955) and Padova 2000 tracks (Girardi et al. 2000). FADO’s results indicate that the mean nebular extinction across the galaxy is AV ∼ 1.6 mag.
Stellar kinematic extraction was carried out using both PPXF (Cappellari & Emsellem 2004; Cappellari 2017), fitting four and six Gaussian-Hermite moments (see Fig. A.1) with two sets of templates, the Indo-US Library of Coudé Feed Stellar Spectra (IUS; Valdes et al. 2004) and MILES (Sánchez-Blázquez et al. 2006), as well as BAYES-LOSVD (Falcón-Barroso & Martig 2021), within the full spectral range and using no regularisation (pure simplex, SP) by default, and random walk (RW) if SP failed to fit the observed spectrum. Considering that star-formation can lead to significant contamination of the stellar spectra by the nebular continuum, thus diluting absorption features which are vital for accurate stellar kinematic measurements, the spectra were decontaminated prior to fitting. Such was performed by assessing and subtracting the nebular continuum contribution, this way ensuring that only stellar emission (and emission lines, which are later masked) remain2. Modelling of the nebular continuum was performed by following the technique from Papaderos et al. (1998) with the adjustment of using the observed Hα flux instead of the EW(Hα). Further details are provided in the Appendix.
The underlying contribution of the main body of several physical properties was modelled with KINEMETRY (Krajnović et al. 2006) and subsequently subtracted (see Figs. A.4–A.7). This algorithm conducts harmonic expansion of 2D maps of observed moments, including surface brightness, mean velocity, and velocity dispersion, along the best-fitting ellipses, and can be employed in various other datasets that retain an underlying symmetrical structure. This step was instrumental, as it allowed us to tentatively account for elementary substructures of various maps (e.g. the stellar kinematic component associated with the galaxy’s gravitational potential). The retrieved residuals amidst and beyond the more prominent spiral arms were analysed, which were manually delineated upon the Hubble Space Telescope (HST) residual map. Radial profiles were determined using the python package PHOTUTILS.ISOPHOTE (Bradley et al. 2021), representing the azimuthally averaged flux in elliptical apertures (see Fig. A.2) as a function of radius. Uncertainties were derived by performing Monte Carlo (MC) simulations for 100 realisations, both for spectral synthesis and stellar kinematic extraction with PPXF. In both cases, MC simulations were performed by adding random noise to the original spectrum drawn from a normal distribution and scaled to match the typical residuals between the observed and the best-fit model. Finally, the AVR across the entire galaxy was examined, and we investigated how the mean σ⋆ and the luminosity-weighted stellar age, τ⋆,L, vary by selecting spaxels with progressively higher EWH(α).
3. Results
In this section, we provide an overview of the main results obtained after processing the MUSE datacube of NGC 4030 with our pipeline (Breda et al., in prep.) and the ensuing modelling and subtraction of the baseline contribution of maps of several physical properties by means of KINEMETRY. In this fashion, maps of stellar age, stellar velocity dispersion, Hα, and EW(Hα) were retrieved, and radial profiles amidst and beyond the delineated spiral arms were computed. To provide a comparative reference, radial profiles of the entire map are also included.
Panel a of Fig. 1 displays our selection of the main spiral arms of NGC 4030, identified using the baseline-subtracted HST F450W photometric frame (i.e, after subtracting the best-fitting KINEMETRY model). This selection serves as a reference throughout this study, thereby defining the regions of interest to be contrasted with the remaining regions of the galaxy. Inspection of panel b, displaying the baseline-subtracted σ⋆ map (Δσ⋆), confirms that these regions of interest align with areas where σ⋆ decreases. The radial profiles presented in panel c reveal that within these regions, σ⋆ tends to be systematically lower by 2−8 km/s as compared to the surrounding areas. We note that with a median uncertainty of 1.7 km/s in σ⋆, Δσ⋆ falls within the precision required to capture the observed variations. As expected, the radial profile of the entire map is consistent with the profile evaluated outside the delineated spiral arm regions; however, it shows lower values due to the inclusion of the inner regions where σ⋆ is systematically lower.
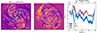 |
Fig. 1. Defining the spiral arms. Panel a: Illustration of the selected regions highlighting the spiral arms of NGC 4030, having as reference the HST photometric frame in the filter F450W, after modelling and subtracting the contribution of the underlying main body with KINEMETRY. Panel b: Stellar velocity dispersion residual map (Δσ⋆) of NGC 4030 with the spiral arms overlaid. Panel c: Radial profiles of Δσ⋆ amidst (blue) and beyond (red) the delineated spiral arms, as well as across the entire galaxy (grey). The upper horizontal axis displays the distance from the centre in kpc. |
Subsequently, we aimed at exploring how σ⋆ fluctuations correlate with the ages of the stellar populations and star-formation activity within these regions. Panel b of Fig. 2 displays the baseline-subtracted luminosity-weighted stellar age of NGC 4030. Similarly to other quantities under study, this map was obtained using KINEMETRY to model and subtract the underlying structure of the 2D stellar age distribution derived by FADO. The radial profiles displayed in panel c confirm that the regions of interest are generally younger (0.25−1.25 Gyr, with a median uncertainty of 0.07 Gyr and maximum of 0.25 Gyr) compared to the surrounding areas, particularly towards larger radii. Complementary Hα and EW(Hα) maps are shown in Fig. A.3, panels a and c, respectively. The residual Hα map, ΔHα, is obtained by modelling and subtracting the best-fitting underlying main body from the Hα map assessed by FADO using KINEMETRY, while the EW(Hα) map derives directly from FADO. These maps clearly indicate that both ΔHα and EW(Hα) are significantly enhanced within the regions of interest compared to the surrounding areas, suggesting increased star-formation activity. The combined evidence supports a coherent scenario: Stellar populations currently forming in the spiral arms exhibit a systematically lower σ⋆ compared to older stellar populations, which tend to be kinematically hotter. This finding aligns with the picture where stars are currently being born from cold gas and inherit its low σbirth.
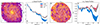 |
Fig. 2. Assessing average stellar age estimates amidst and beyond the delineated spiral arms. Panels a and b: Luminosity-weighted stellar age assessed by FADO followed by the respective radial profiles, amidst (blue) and beyond (red) the delineated spiral arms. Grey denotes the radial profile across the entire galaxy. Panels c and d: Comparable to panels a and b but displaying instead the baseline-subtracted (i.e. after subtracting KINEMETRY’s best-fitting model) luminosity-weighted stellar age map of NGC 4030. |
Panel a of Fig. 3 displays the AVR for NGC 4030 with luminosity-weighted stellar ages assessed by FADO revealing an S-shaped pattern. It can be appreciated that, overall, younger stellar populations forming at larger galactocentric radii generally retain lower σ⋆ values, in contrast to the kinematically hotter older populations in the galactic centre and surrounding areas. Interestingly, stellar populations that originated around 7−8 Gyr ago exhibit a wide range of σ⋆ values that are strongly dependent on their galactocentric radius, suggesting a rapid formation phase across the sampled galactic region at this epoch. Nevertheless, interpreting the AVR is not a straightforward task. Speculatively, the complex structure of the AVR might indicate that several factors are at play, such as a combination of inherited σbirth, along with continuous kinematical heating by cumulative perturbations. While early minor mergers cannot be excluded, we dismiss major mergers as significant contributors, considering the galaxy’s undisturbed morphology. Finally, to ensure that our findings are not driven by our customised selection delineating the spiral arms nor by the subtraction of the underlying contribution from the various maps by means of KINEMETRY, panels b and c display several σ⋆ and τ⋆,L radial profiles, enabling a comparison of their distributions across the entire galaxy with those derived from spaxels exhibiting progressively higher levels of EW(Hα). It is evident that σ⋆ in NGC 4030 gradually decreases as spaxels with higher EW(Hα) levels are examined, revealing an anti-correlation between these physical properties. Unsurprisingly, a similar behaviour is documented for the luminosity-weighted stellar age, τ⋆,L.
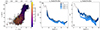 |
Fig. 3. Investigating the age-velocity relation of NGC 4030. Panel a: AVR of NGC 4030 accounting for all bins displaying luminosity-weighted ages obtained with FADO. Values of the redshift at each τ⋆,L are provided along the upper horizontal axis. Panel b: Radial profiles of the observed σ⋆ obtained for the whole map (grey) and for a subset of spaxels that show increasing levels of EW(Hα) (in blue, with lighter shades corresponding to higher EW(Hα) levels). Panel c: Similar to panel a but illustrating the radial distribution of the luminosity-weighted stellar age. |
4. Conclusions
Kinematic analysis of NGC 4030 has revealed a grand design spiral pattern in the stellar velocity dispersion map that spatially correlates with HII regions. This outcome is independent of the empirically selected regions outlining the spiral arms, as higher EW(Hα) spaxels show a lower σ⋆ and τ⋆,L. The presence of younger stellar populations and a lower σ⋆ in these areas points to recent star-formation from cold gas, where new stars inherit the gas’s low σ. Comparably to our own MW and other galaxies, NGC 4030’s AVR indicates that younger (older) stellar populations generally exhibit a lower (higher) σ⋆.
Although the precise dynamical mechanisms driving the curved shape of NGC 4030’s AVR remain challenging to determine, comparison with simulations might provide valuable insights. Admittedly, NGC 4030 is significantly more massive than the MW (M⋆, MW ≃ 0.6 × 10¹¹ M⊙, Licquia & Newman 2015, and M⋆, NGC 4030 ≃ 1.5 × 10¹¹ M⊙, Erroz-Ferrer et al. 2019), and consequently also more massive than the simulated galaxy h277 from Bird et al. (2021). Nevertheless, the simulated AVR is notably steep for ages similar to those observed in our study (see their Figs. 1 and 5), which is seemingly compatible with NGC 4030’s AVR. However, fundamental methodological differences obstruct direct comparison: While Bird et al. (2021) provides the velocity dispersion and ages of individual stars, our analysis renders a line-of-sight velocity distribution as well as luminosity-weighted ages across numerous stars, substantially enhancing our σ⋆ estimates and diluting our age estimates. Accordingly, we can only speculate that the apparent resemblance between the AVR from h277 and the MW might suggest that similar mechanisms are operating. Specifically, the presently observed σ⋆ may reflect both the primordial σbirth from the progenitor gas as well as gradual heating from cumulative interactions with perturbative agents during the stars’ lifetime. Recalling the findings in h277, at higher redshift there is a greater fraction of available gas in the disc. Such increases gravitational turbulence, ultimately leading to a higher σbirth for stars born during these periods. As turbulence is strong, favourable conditions for star-formation are primarily attained towards the centre and galactic plane, where stellar populations emerge first. Over time, as the disc settles, stars form at larger radii and latitudes from colder gas and inherit a lower σbirth. Subsequent encounters with perturbing elements, such as GMCs concentrated in the mid-plane, significantly contribute to the currently observed σ⋆, promoting radial mixing and migration towards larger radii and higher latitudes. Concerning the study conducted by Martig et al. (2014b), the majority of the simulated AVRs, particularly those without a subsequent merger history, exhibit a similar pattern to the AVR of NGC 4030 and h277. Interestingly, the AVR that most closely resembles our findings (after adjusting σ⋆ by summing a constant value) is associated with g106, which is the largest simulated galaxy with a 1:5 merger occurrence about 7 Gyr ago.
In conclusion, the apparent similarity between the structure of the simulated AVRs and that of NGC 4030, namely the S-shape for τ⋆,L ≳ 4 Gyr, might suggest that analogous physical mechanisms are at play. Within this framework, the AVR initially arises from the formation of stellar populations at different epochs, each originating from gas at varying temperatures and/or turbulence levels and thus retaining the imprint of their original σbirth. Subsequently, cumulative interactions with perturbative agents gradually increase the σ⋆ over the stars’ lifetime. While other mechanisms, such as past minor mergers, cannot be discarded, this scenario offers a fair explanation for our observations. The significant discovery of complex patterns in the σ⋆ map tracing spiral arms and HII regions offers new opportunities for comparative studies of disc heating mechanisms and advances our understanding of galaxy formation by providing a rich dataset for benchmarking against simulations.
Data availability
The Appendix can be accessed at https://doi.org/10.5281/zenodo.14356526
Interestingly, similar σ⋆ features have been previously detected in the innermost region of NGC 1097 (see Fig. 2 of Gadotti et al. 2020).
For completeness, stellar kinematic maps obtained without subtracting the nebular continuum contribution are provided in the Appendix.
Acknowledgments
We thank Dr. Emily Wisnioski for her insightful comments and suggestions as referee. I.B. has received funding from the European Union’s Horizon 2020 research and innovation programme under the Marie Sklodowska-Curie Grant agreement ID n.° 101059532. I.P. acknowledges funding by the European Research Council through ERC-AdG SPECMAP-CGM, GA 101020943. D.A.G. is supported by STFC grants ST/T000244/1 and ST/X001075/1. J.F.-B. acknowledges support from the PID2022-140869NB-I00 grant from the Spanish Ministry of Science and Innovation.
References
- Aumer, M., & Binney, J. J. 2009, MNRAS, 397, 1286 [NASA ADS] [CrossRef] [Google Scholar]
- Aumer, M., Binney, J., & Schönrich, R. 2016, MNRAS, 462, 1697 [NASA ADS] [CrossRef] [Google Scholar]
- Bacon, R., Accardo, M., Adjali, L., et al. 2010, Proc. SPIE, 7735, 773508 [Google Scholar]
- Barbanis, B., & Woltjer, L. 1967, ApJ, 150, 461 [NASA ADS] [CrossRef] [Google Scholar]
- Binney, J., & Tremaine, S. 2008, Galactic Dynamics: Second Edition (Princeton: Princeton University Press) [Google Scholar]
- Bird, J. C., Loebman, S. R., Weinberg, D. H., et al. 2021, MNRAS, 503, 1815 [NASA ADS] [CrossRef] [Google Scholar]
- Bradley, L., Sipőcz, B., Robitaille, T., et al. 2021, https://doi.org/10.5281/zenodo.6825092 [Google Scholar]
- Bruzual, G., & Charlot, S. 2003, MNRAS, 344, 1000 [NASA ADS] [CrossRef] [Google Scholar]
- Carlberg, R. G., & Sellwood, J. A. 1985, ApJ, 292, 79 [NASA ADS] [CrossRef] [Google Scholar]
- Cappellari, M. 2017, MNRAS, 466, 798 [Google Scholar]
- Cappellari, M., & Copin, Y. 2003, MNRAS, 342, 345 [Google Scholar]
- Cappellari, M., & Emsellem, E. 2004, PASP, 116, 138 [Google Scholar]
- Casagrande, L., Schönrich, R., Asplund, M., et al. 2011, A&A, 530, A138 [NASA ADS] [CrossRef] [EDP Sciences] [Google Scholar]
- Dehnen, W. 2000, AJ, 119, 800 [NASA ADS] [CrossRef] [Google Scholar]
- De Simone, R., Wu, X., & Tremaine, S. 2004, MNRAS, 350, 62 [Google Scholar]
- Dorman, C. E., Guhathakurta, P., Seth, A. C., et al. 2015, ApJ, 803, 24 [Google Scholar]
- Erroz-Ferrer, S., Carollo, C. M., den Brok, M., et al. 2019, MNRAS, 484, 5009 [Google Scholar]
- Falcón-Barroso, J., & Martig, M. 2021, A&A, 646, A31 [NASA ADS] [CrossRef] [EDP Sciences] [Google Scholar]
- Fatheddin, H., & Sajadian, S. 2023, ApJ, 945, 75 [NASA ADS] [CrossRef] [Google Scholar]
- Förster, Schreiber N. M., Genzel, R., Bouché, N., et al. 2009, ApJ, 706, 1364 [CrossRef] [Google Scholar]
- Freeman, K. C. 1991, Dynamics of Disc Galaxies (Göteborg: Göteborgs University) [Google Scholar]
- Gadotti, D. A., Bittner, A., Falcón-Barroso, J., et al. 2020, A&A, 643, A14 [NASA ADS] [CrossRef] [EDP Sciences] [Google Scholar]
- Genzel, R., Newman, S., Jones, T., et al. 2011, ApJ, 733, 101 [Google Scholar]
- Girardi, L., Bressan, A., Bertelli, G., & Chiosi, C. 2000, A&AS, 141, 371 [NASA ADS] [CrossRef] [EDP Sciences] [Google Scholar]
- Goldreich, P., & Tremaine, S. 1980, ApJ, 241, 425 [Google Scholar]
- Gomes, J. M., & Papaderos, P. 2017, A&A, 603, A63 [NASA ADS] [CrossRef] [EDP Sciences] [Google Scholar]
- Gómez, A., Grenier, S., Udry, S., et al. 1997, Proceedings of the ESA Symposium Hipparcos – Venice ’97, 621 [Google Scholar]
- Hänninen, J., & Flynn, C. 2002, MNRAS, 337, 731 [CrossRef] [Google Scholar]
- Huang, S., & Carlberg, R. G. 1997, ApJ, 480, 503 [NASA ADS] [CrossRef] [Google Scholar]
- Kassin, S. A., Weiner, B. J., Faber, S. M., et al. 2012, ApJ, 758, 106 [NASA ADS] [CrossRef] [Google Scholar]
- Kokubo, E., & Ida, S. 1992, PASJ, 44, 601 [NASA ADS] [Google Scholar]
- Krajnović, D., Cappellari, M., de Zeeuw, P. T., & Copin, Y. 2006, MNRAS, 366, 787 [Google Scholar]
- Kumamoto, J., Baba, J., & Saitoh, T. R. 2017, PASJ, 69, 32 [Google Scholar]
- Lacey, C. G., & Ostriker, J. P. 1985, ApJ, 299, 633 [NASA ADS] [CrossRef] [Google Scholar]
- Leaman, R., Mendel, J. T., Wisnioski, E., et al. 2017, MNRAS, 472, 1879 [Google Scholar]
- Licquia, T. C., & Newman, J. A. 2015, ApJ, 806, 96 [NASA ADS] [CrossRef] [Google Scholar]
- Martig, M., Minchev, I., & Flynn, C. 2014a, MNRAS, 442, 2474 [CrossRef] [Google Scholar]
- Martig, M., Minchev, I., & Flynn, C. 2014b, MNRAS, 443, 2452 [Google Scholar]
- Minchev, I., & Famaey, B. 2010, ApJ, 722, 112 [Google Scholar]
- Papaderos, P., Izotov, Y. I., Fricke, K. J., Thuan, T. X., & Guseva, N. G. 1998, A&A, 338, 43 [NASA ADS] [Google Scholar]
- Pessa, I., Schinnerer, E., Sanchez-Blazquez, P., et al. 2023, A&A, 673, A147 [NASA ADS] [CrossRef] [EDP Sciences] [Google Scholar]
- Quillen, A. C., & Garnett, D. R. 2001, ASP Conf. Ser., 230, 87 [NASA ADS] [Google Scholar]
- Quinn, P. J., Hernquist, L., & Fullagar, D. P. 1993, ApJ, 403, 74 [Google Scholar]
- Salpeter, E. E. 1955, ApJ, 121, 161 [Google Scholar]
- Sánchez-Blázquez, P., Gorgas, J., Cardiel, N., & González, J. J. 2006, A&A, 457, 787 [CrossRef] [EDP Sciences] [Google Scholar]
- Spitzer, L., & Schwarzschild, M. 1951, ApJ, 114, 385 [NASA ADS] [CrossRef] [Google Scholar]
- Spitzer, L., & Schwarzschild, M. 1953, ApJ, 118, 106 [NASA ADS] [CrossRef] [Google Scholar]
- Stott, J. P., Swinbank, A. M., Johnson, H. L., et al. 2016, MNRAS, 457, 1888 [Google Scholar]
- Valdes, F., Gupta, R., Rose, J. A., Singh, H. P., & Bell, D. J. 2004, ApJS, 152, 251 [Google Scholar]
- van Donkelaar, F., Agertz, O., & Renaud, F. 2022, MNRAS, 512, 3806 [NASA ADS] [CrossRef] [Google Scholar]
- Walker, I. R., Mihos, J. C., & Hernquist, L. 1996, ApJ, 460, 121 [NASA ADS] [CrossRef] [Google Scholar]
All Figures
|
Fig. 1. Defining the spiral arms. Panel a: Illustration of the selected regions highlighting the spiral arms of NGC 4030, having as reference the HST photometric frame in the filter F450W, after modelling and subtracting the contribution of the underlying main body with KINEMETRY. Panel b: Stellar velocity dispersion residual map (Δσ⋆) of NGC 4030 with the spiral arms overlaid. Panel c: Radial profiles of Δσ⋆ amidst (blue) and beyond (red) the delineated spiral arms, as well as across the entire galaxy (grey). The upper horizontal axis displays the distance from the centre in kpc. |
| In the text | |
|
Fig. 2. Assessing average stellar age estimates amidst and beyond the delineated spiral arms. Panels a and b: Luminosity-weighted stellar age assessed by FADO followed by the respective radial profiles, amidst (blue) and beyond (red) the delineated spiral arms. Grey denotes the radial profile across the entire galaxy. Panels c and d: Comparable to panels a and b but displaying instead the baseline-subtracted (i.e. after subtracting KINEMETRY’s best-fitting model) luminosity-weighted stellar age map of NGC 4030. |
| In the text | |
|
Fig. 3. Investigating the age-velocity relation of NGC 4030. Panel a: AVR of NGC 4030 accounting for all bins displaying luminosity-weighted ages obtained with FADO. Values of the redshift at each τ⋆,L are provided along the upper horizontal axis. Panel b: Radial profiles of the observed σ⋆ obtained for the whole map (grey) and for a subset of spaxels that show increasing levels of EW(Hα) (in blue, with lighter shades corresponding to higher EW(Hα) levels). Panel c: Similar to panel a but illustrating the radial distribution of the luminosity-weighted stellar age. |
| In the text | |
Current usage metrics show cumulative count of Article Views (full-text article views including HTML views, PDF and ePub downloads, according to the available data) and Abstracts Views on Vision4Press platform.
Data correspond to usage on the plateform after 2015. The current usage metrics is available 48-96 hours after online publication and is updated daily on week days.
Initial download of the metrics may take a while.