Fig. 3.
Download original image
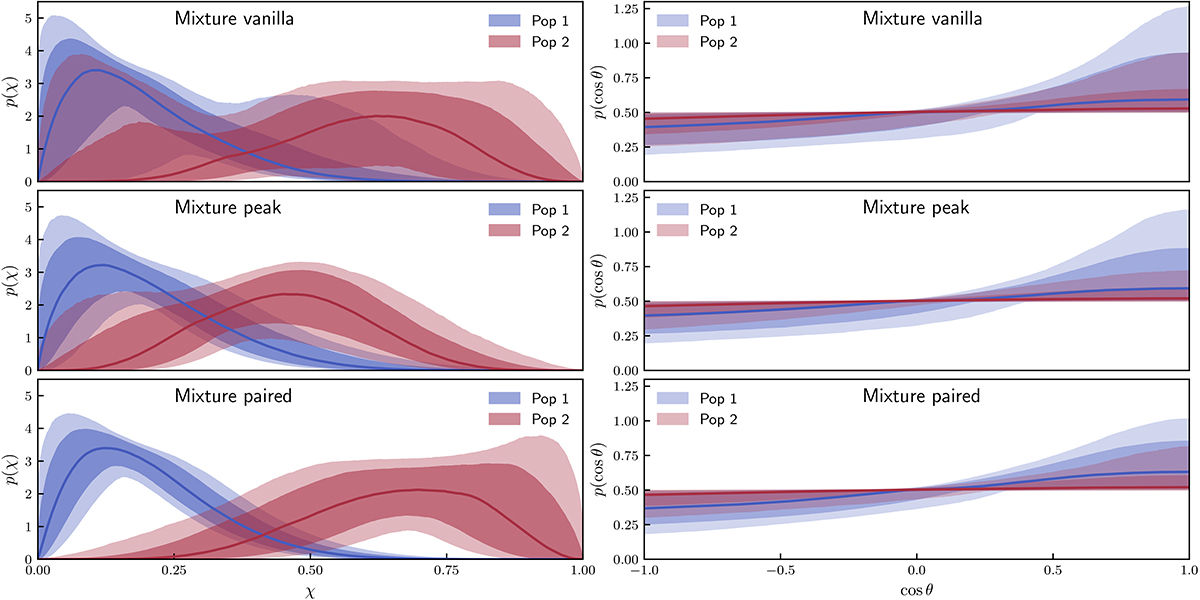
Mixture spin distributions: Probability density functions of the reconstructed spin magnitudes, χ, and the cosine of the tilt angles for each of the three mixture inferences, obtained on the 59 BBHs with an IFAR ≥ 1 yr from the GWTC-3 catalog. The red curves (Pop1) are the spin magnitudes and tilt angles found for the first population and the blue curves (Pop2) for the second population. The light blue curves (Total) are the combined distributions. The contours are the 90% and 95% confidence intervals.
Current usage metrics show cumulative count of Article Views (full-text article views including HTML views, PDF and ePub downloads, according to the available data) and Abstracts Views on Vision4Press platform.
Data correspond to usage on the plateform after 2015. The current usage metrics is available 48-96 hours after online publication and is updated daily on week days.
Initial download of the metrics may take a while.