Fig. 3
Download original image
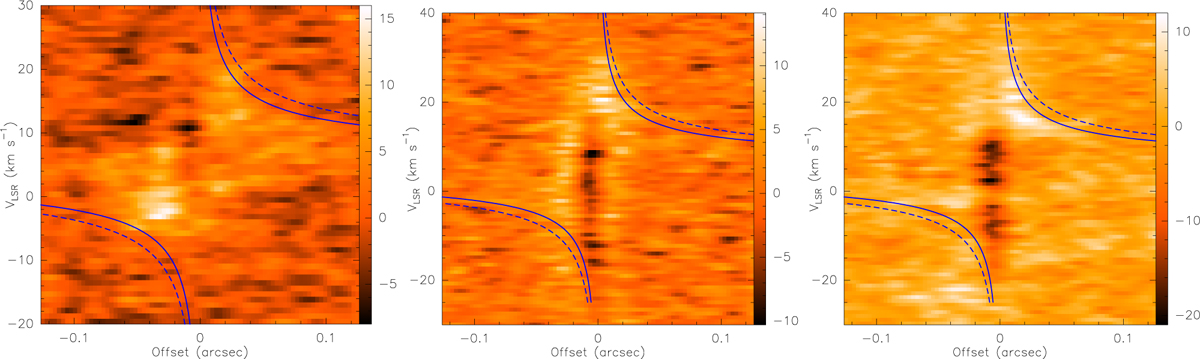
Position-velocity diagrams for the C34S(7–6) (left panel), SiO(8–7) (central panel), and CO(3–2) (right panel) emission generated along the path shown in Fig. 2. The intensity scale is in mJy beam−1. The curves correspond to Keplerian rotation around the central mass of M sin2 i = 10 M⊙ (solid) and M sin2 i = 15 M⊙ (dashed), where i is the inclination angle.
Current usage metrics show cumulative count of Article Views (full-text article views including HTML views, PDF and ePub downloads, according to the available data) and Abstracts Views on Vision4Press platform.
Data correspond to usage on the plateform after 2015. The current usage metrics is available 48-96 hours after online publication and is updated daily on week days.
Initial download of the metrics may take a while.