Fig. 1
Download original image
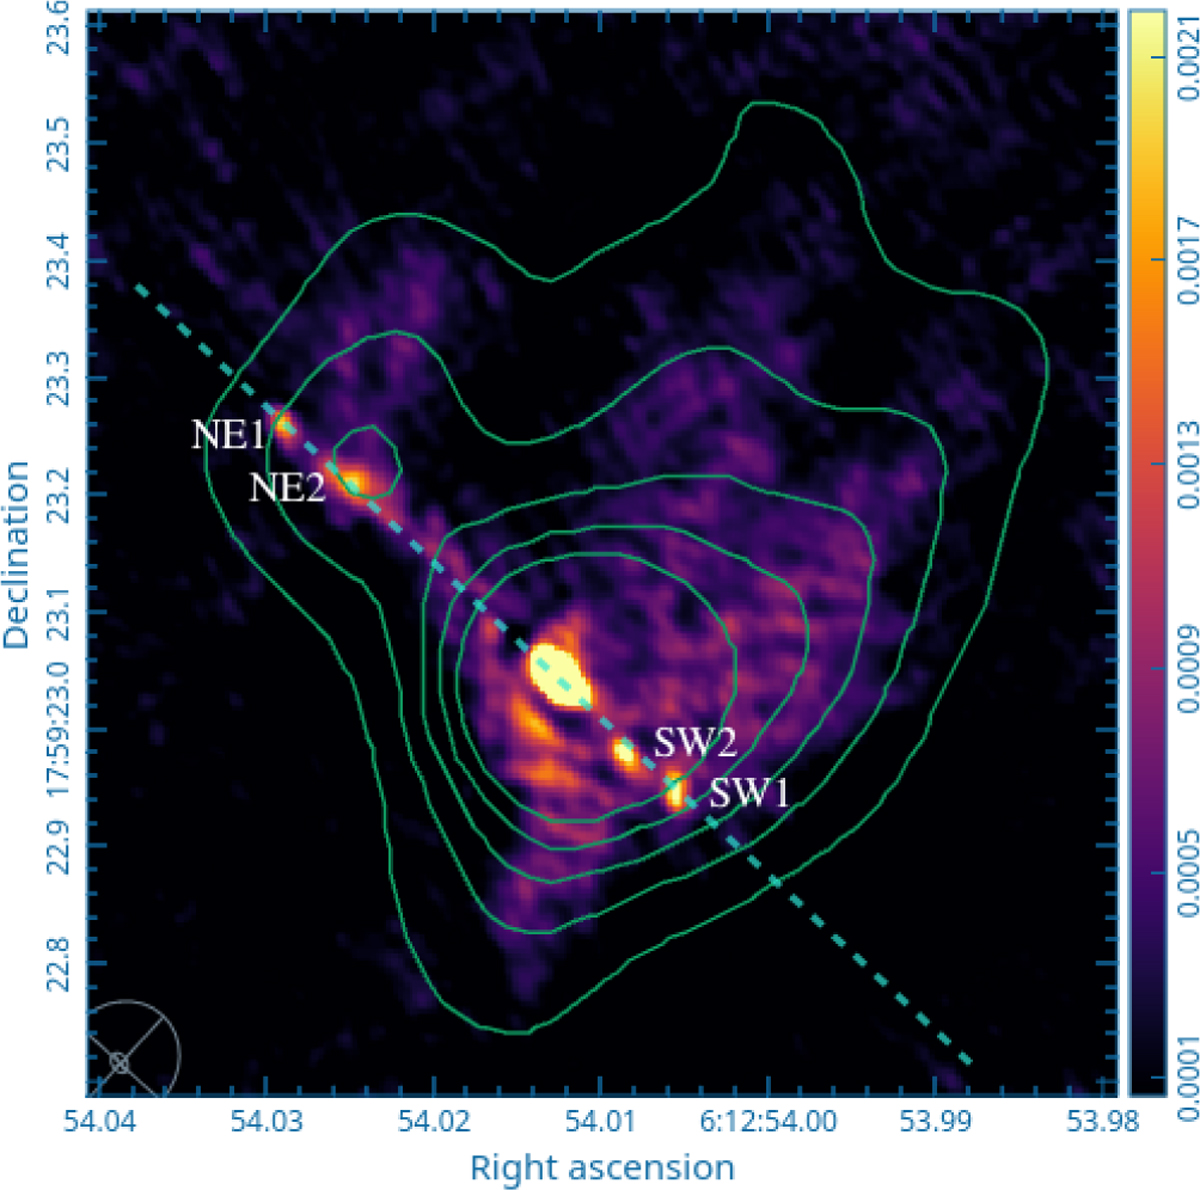
Continuum image of the S255IR region. The intensity scale is in Jy beam−1. The contours show the low-resolution continuum emission. The contour levels are from 4 to 20 in steps of 4 mJy beam−1. The dashed line has a position angle of 47°. The four bright knots in the jet lobes are marked. The synthesized beams are shown in the lower left corner.
Current usage metrics show cumulative count of Article Views (full-text article views including HTML views, PDF and ePub downloads, according to the available data) and Abstracts Views on Vision4Press platform.
Data correspond to usage on the plateform after 2015. The current usage metrics is available 48-96 hours after online publication and is updated daily on week days.
Initial download of the metrics may take a while.