Fig. 3
Download original image
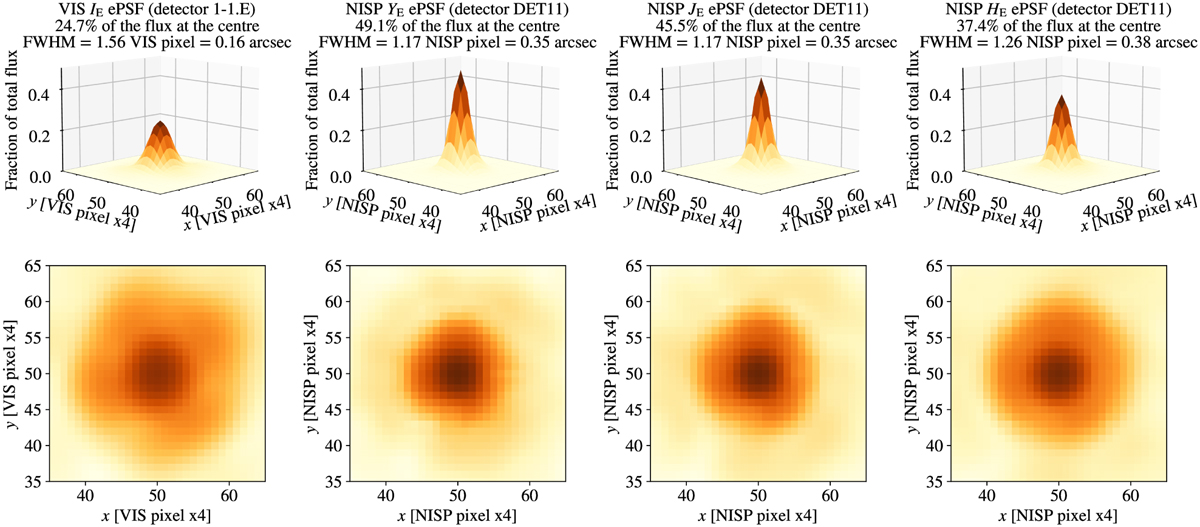
Overview of the Euclid’s ePSFs modelled in our analysis. The top row shows a 3D representation of our ePSFs for the VIS quadrant 1-1.E and for the NISP detector DET11 in each of the three NISP filters. At the top of each panel, we provide the percentage of flux of the star within the centremost pixel, and the full width at half maximum (FWHM) in pixel and in arcsec. The bottom row contains the 2D view of the ePSFs. The scale is logarithmic and the same in all these four panels.
Current usage metrics show cumulative count of Article Views (full-text article views including HTML views, PDF and ePub downloads, according to the available data) and Abstracts Views on Vision4Press platform.
Data correspond to usage on the plateform after 2015. The current usage metrics is available 48-96 hours after online publication and is updated daily on week days.
Initial download of the metrics may take a while.