Fig. C.1
Download original image
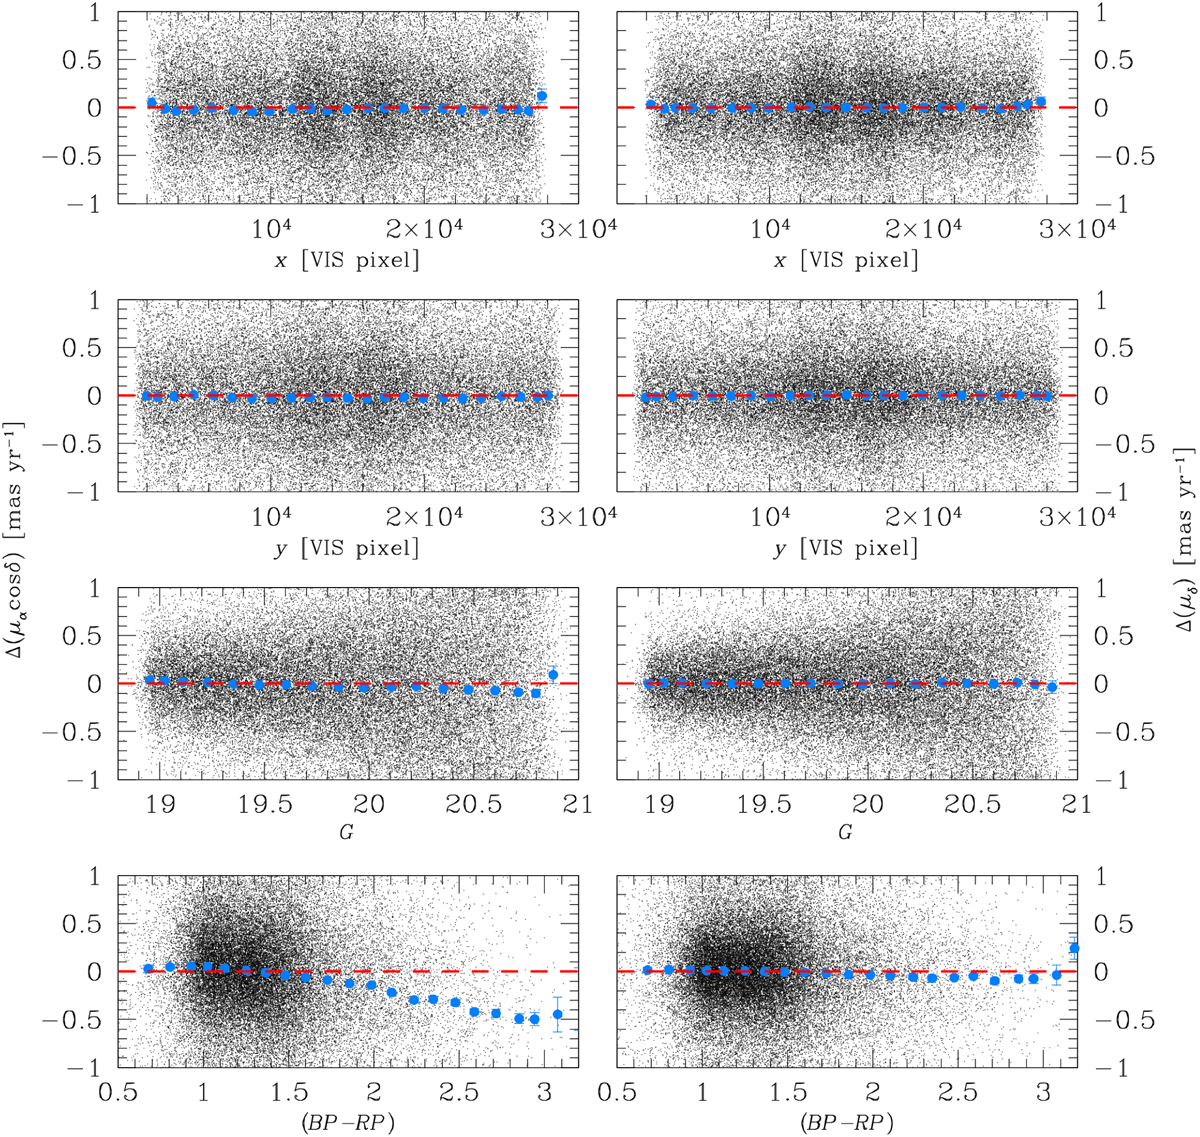
Difference between our E-G and the Gaia DR3 PMs as a function of (from top to bottom) x position, y position, G magnitude, and (BP – RP) colour. The left column refers to the µα cos δ component of the PM, whereas the right column focuses on the µδ component. In all plots, the red dashed line is set to 0 as a reference. Blue points are the median values (and their errors) of the Δ PM in bins of size 2500 pixels (first two rows from the top; step of 1250 pixels) or 0.25 magnitude (the other panels; step of 0.125 magnitude).
Current usage metrics show cumulative count of Article Views (full-text article views including HTML views, PDF and ePub downloads, according to the available data) and Abstracts Views on Vision4Press platform.
Data correspond to usage on the plateform after 2015. The current usage metrics is available 48-96 hours after online publication and is updated daily on week days.
Initial download of the metrics may take a while.