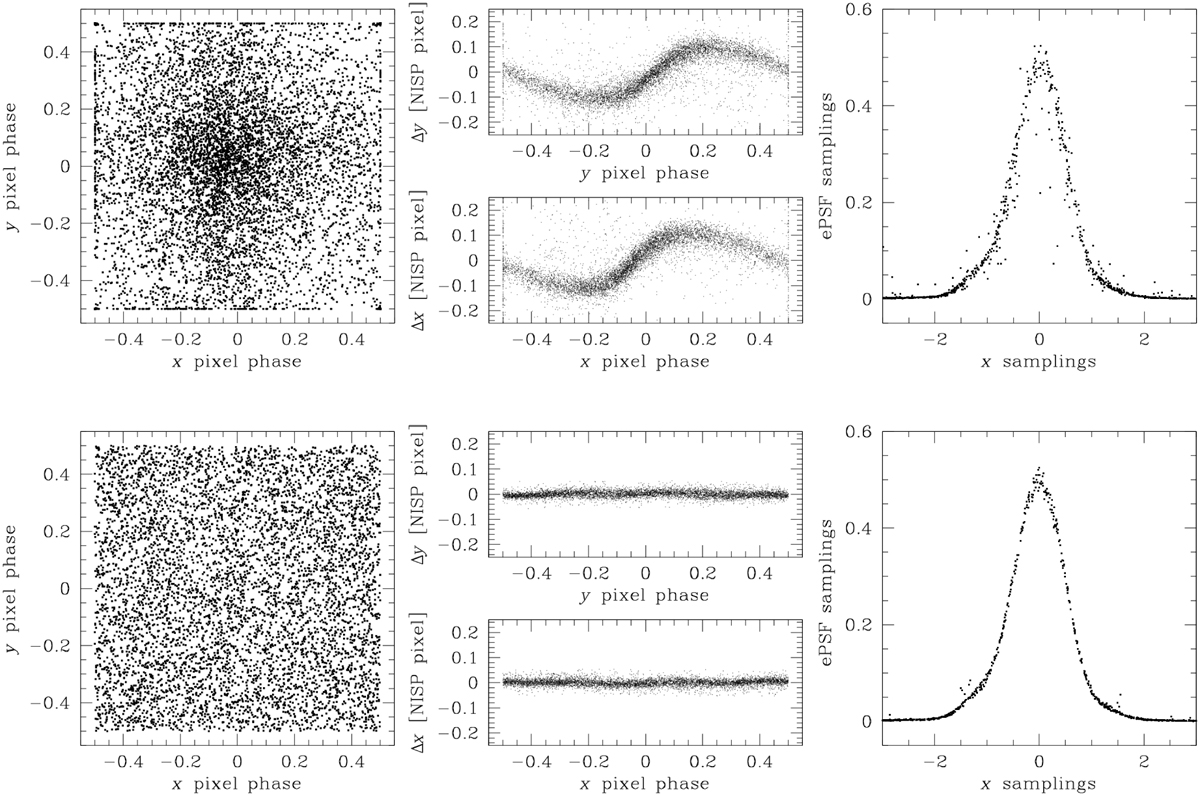
Fig. 2
Download original image
Example of the iterative derivation of the ePSF for the most undersampled instrument/filter combination (i.e. the NISP YE filter). The top row shows the first iteration, while the bottom row is the last iteration. In each row, we show from left to right: (i) where the centres of the stars are measured to be with respect to the pixel boundaries (the origin of the plot is the centre of the pixel); (ii) pixel-phase errors for the positional residuals (defined as the difference between the single Euclid exposure positions and the Gaia positions transformed back onto the Euclid frame) along the x (top) and y (bottom) axes; and (iii) ePSF samplings with respect to the centre of the ePSF placed at 0 along the x axis in a small strip (Δy < 0.01 pixel) around the centre of the ePSF. In the rightmost panels, a given star contributes to the plot with different points (one per sampled pixel), at odds with the panels in the first two columns from the left where each point corresponds the position of a star.
Current usage metrics show cumulative count of Article Views (full-text article views including HTML views, PDF and ePub downloads, according to the available data) and Abstracts Views on Vision4Press platform.
Data correspond to usage on the plateform after 2015. The current usage metrics is available 48-96 hours after online publication and is updated daily on week days.
Initial download of the metrics may take a while.