Fig. 13
Download original image
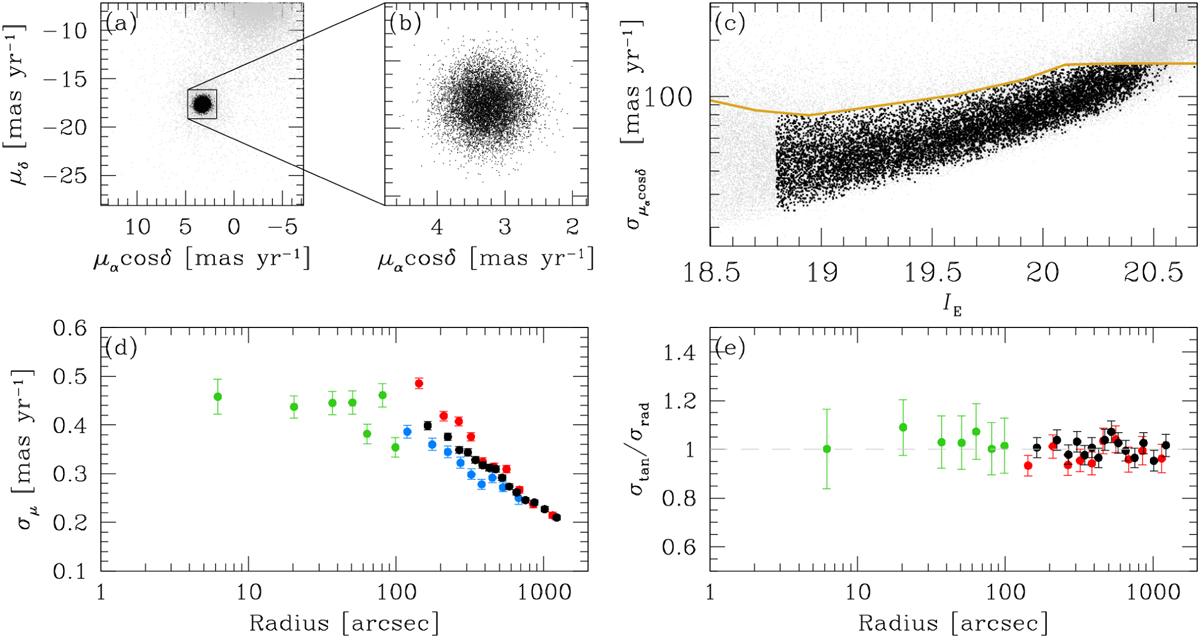
Velocity-dispersion and anisotropy radial profiles for NGC 6397. Panel a shows the VPD of the E-G PMs. Black dots are the cluster members that survived all our selection criteria and were used to compute the velocity dispersion of NGC 6397. All other stars are plotted as grey points. Panel b presents a zoom-in around the cluster distribution in the VPD (only black points are included for clarity). The PM error along α cos δ as a function of IE magnitude is shown in panel c. The gold line represents the PM threshold used to select the best stars for the analysis (the same selection was applied to the PM error along δ; see the text for details). The combined velocity dispersion σµ as function of distance from the centre of the cluster (in arcsec) is plotted in the panel d. Black, filled points are obtained by means of the E-G PMs; green points are from Libralato et al. (2022); blue points refer to the Gaia-EDR3 measurements of Vasiliev & Baumgardt (2021); and the red points represent our cross-check with the Gaia DR3 catalogue. Finally, panel e shows the anisotropy (σtan/σrad) radial profile. Points are colour-coded as in the previous panel (no anisotropy measurements are provided by Vasiliev & Baumgardt 2021). The grey, dashed line is set to 1 (i.e. isotropic case) as a reference.
Current usage metrics show cumulative count of Article Views (full-text article views including HTML views, PDF and ePub downloads, according to the available data) and Abstracts Views on Vision4Press platform.
Data correspond to usage on the plateform after 2015. The current usage metrics is available 48-96 hours after online publication and is updated daily on week days.
Initial download of the metrics may take a while.