Fig. 4
Download original image
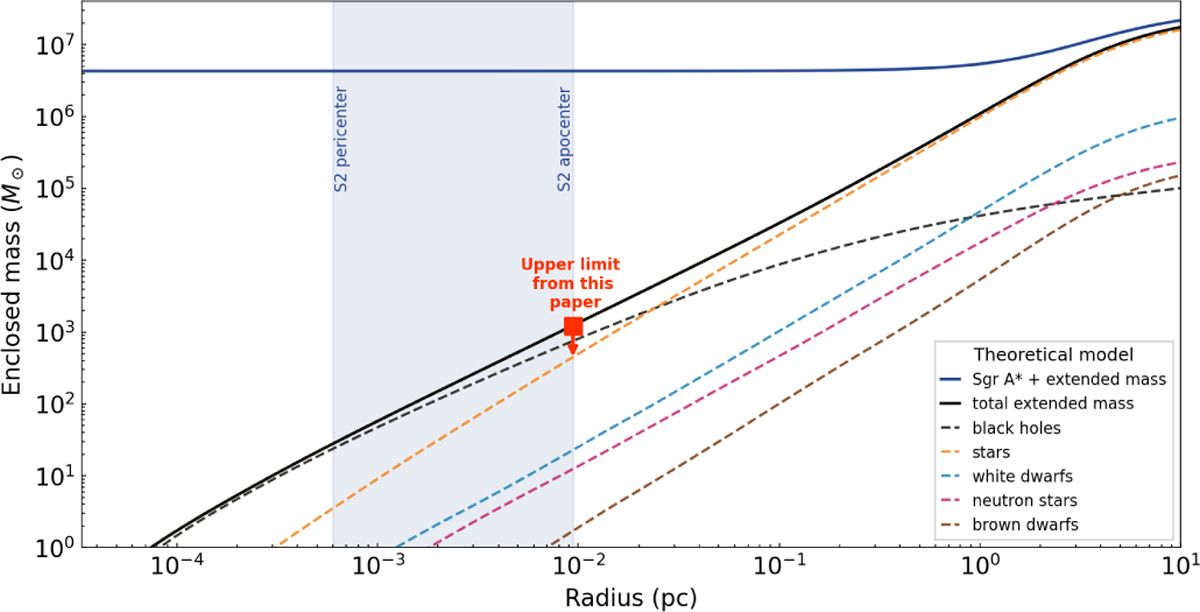
Enclosed mass in the GC as a function of radius derived from numerical simulations, using an updated version of the code from Zhang & Amaro-Seoane (2024), for a model that includes stellar black holes, neutron stars, white dwarfs, brown dwarfs, and stars. The dashed colored lines show the predicted enclosed mass of each individual component, while the solid black line shows the total predicted enclosed mass considering all components. The predicted enclosed mass within S2’s orbit is in agreement with our 1σ upper limit of ≈1200 M⊙, indicated by the red square. The solid blue line shows the sum of the mass of Sgr A* to the total predicted enclosed mass. The shaded blue region illustrates the radial range of the orbit of S2.
Current usage metrics show cumulative count of Article Views (full-text article views including HTML views, PDF and ePub downloads, according to the available data) and Abstracts Views on Vision4Press platform.
Data correspond to usage on the plateform after 2015. The current usage metrics is available 48-96 hours after online publication and is updated daily on week days.
Initial download of the metrics may take a while.