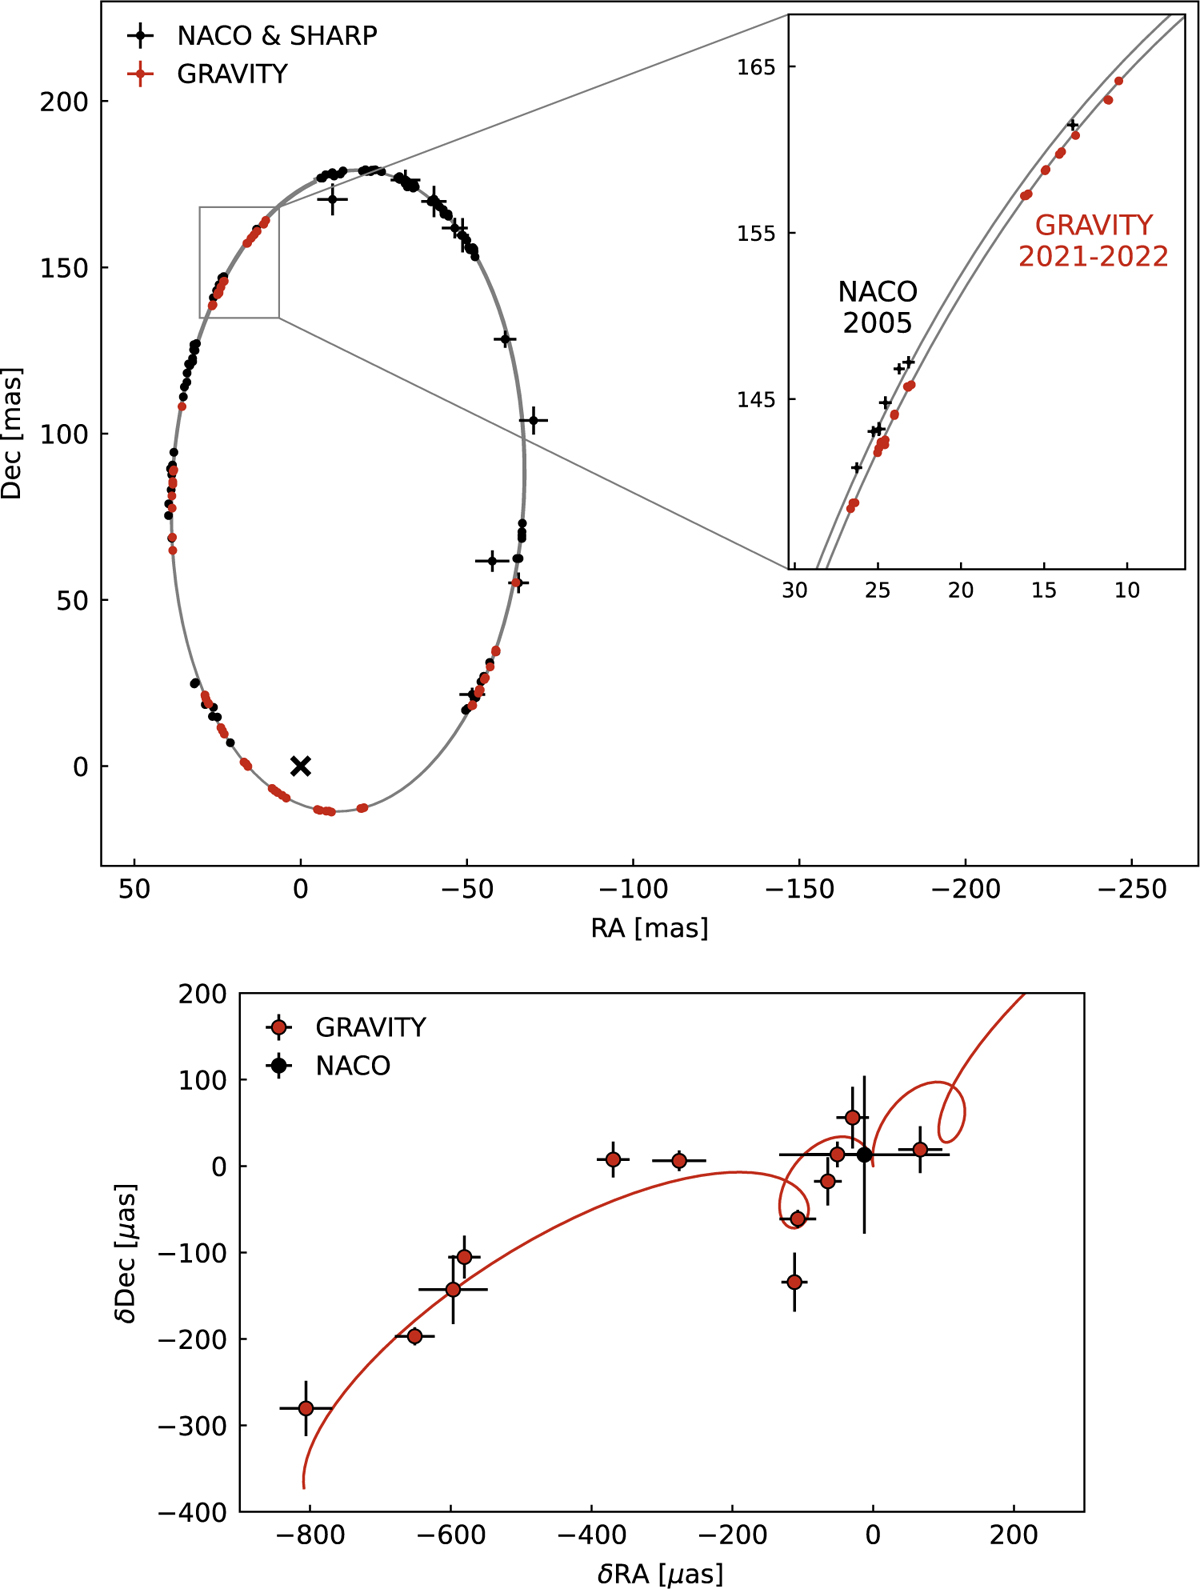
Fig. 2
Download original image
The SP in the orbit of S2 around Sgr A*. Top: astrometric data of S2 obtained from 1992 to the end of 2022, together with the best-fitting orbit. The SHARP and NACO data are in black, while the GRAVITY data are in red. Sgr A* is located at (0,0), marked by a black cross. A zoom-in shows the effect of the prograde SP, comparing the GRAVITY 2021–2022 data with the NACO 2005 data. Bottom: residuals in RA and Dec between the best-fit Schwarzschild orbit (fS P = 1) and the Newtonian component of the same orbit (fS P = 0). In the plot, the Schwarzschild orbit predicted by GR corresponds to the loopy red curve. The corresponding residual GRAVITY data with respect to the Newtonian orbit are represented by red circles, and the NACO data by a black circle. The GRAVITY data points follow the Schwarzschild orbit predicted by GR. GRAVITY data are averages of several epochs. The NACO data have been averaged into one single data point.
Current usage metrics show cumulative count of Article Views (full-text article views including HTML views, PDF and ePub downloads, according to the available data) and Abstracts Views on Vision4Press platform.
Data correspond to usage on the plateform after 2015. The current usage metrics is available 48-96 hours after online publication and is updated daily on week days.
Initial download of the metrics may take a while.