Fig. 7
Download original image
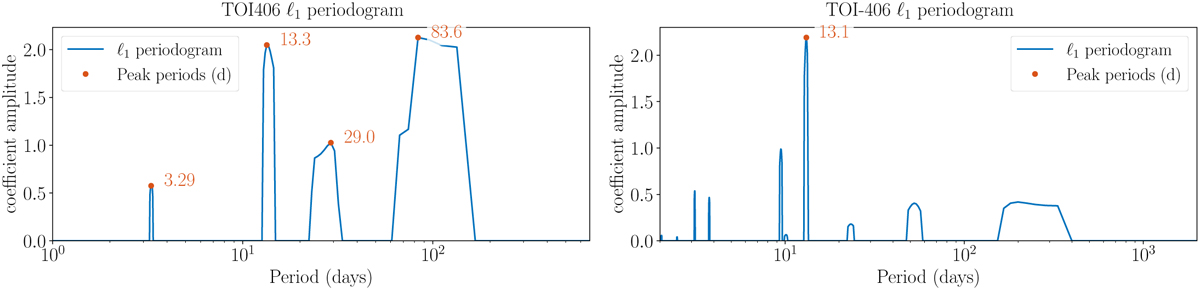
ℓ1 periodogram of the ESPRESSO (left) and the combined NIRPS+HARPS datasets (right), computed on a grid of frequencies from 0 to 1 cycle per day. The total time span of the ESPRESSO and NIRPS/HARPS observations is ~72 and ~204 days, respectively. Each periodogram highlights in orange the significant peaks (with ∆ In 𝒵 > 10, where 𝒵 is the Bayesian evidence).
Current usage metrics show cumulative count of Article Views (full-text article views including HTML views, PDF and ePub downloads, according to the available data) and Abstracts Views on Vision4Press platform.
Data correspond to usage on the plateform after 2015. The current usage metrics is available 48-96 hours after online publication and is updated daily on week days.
Initial download of the metrics may take a while.