Fig. 5
Download original image
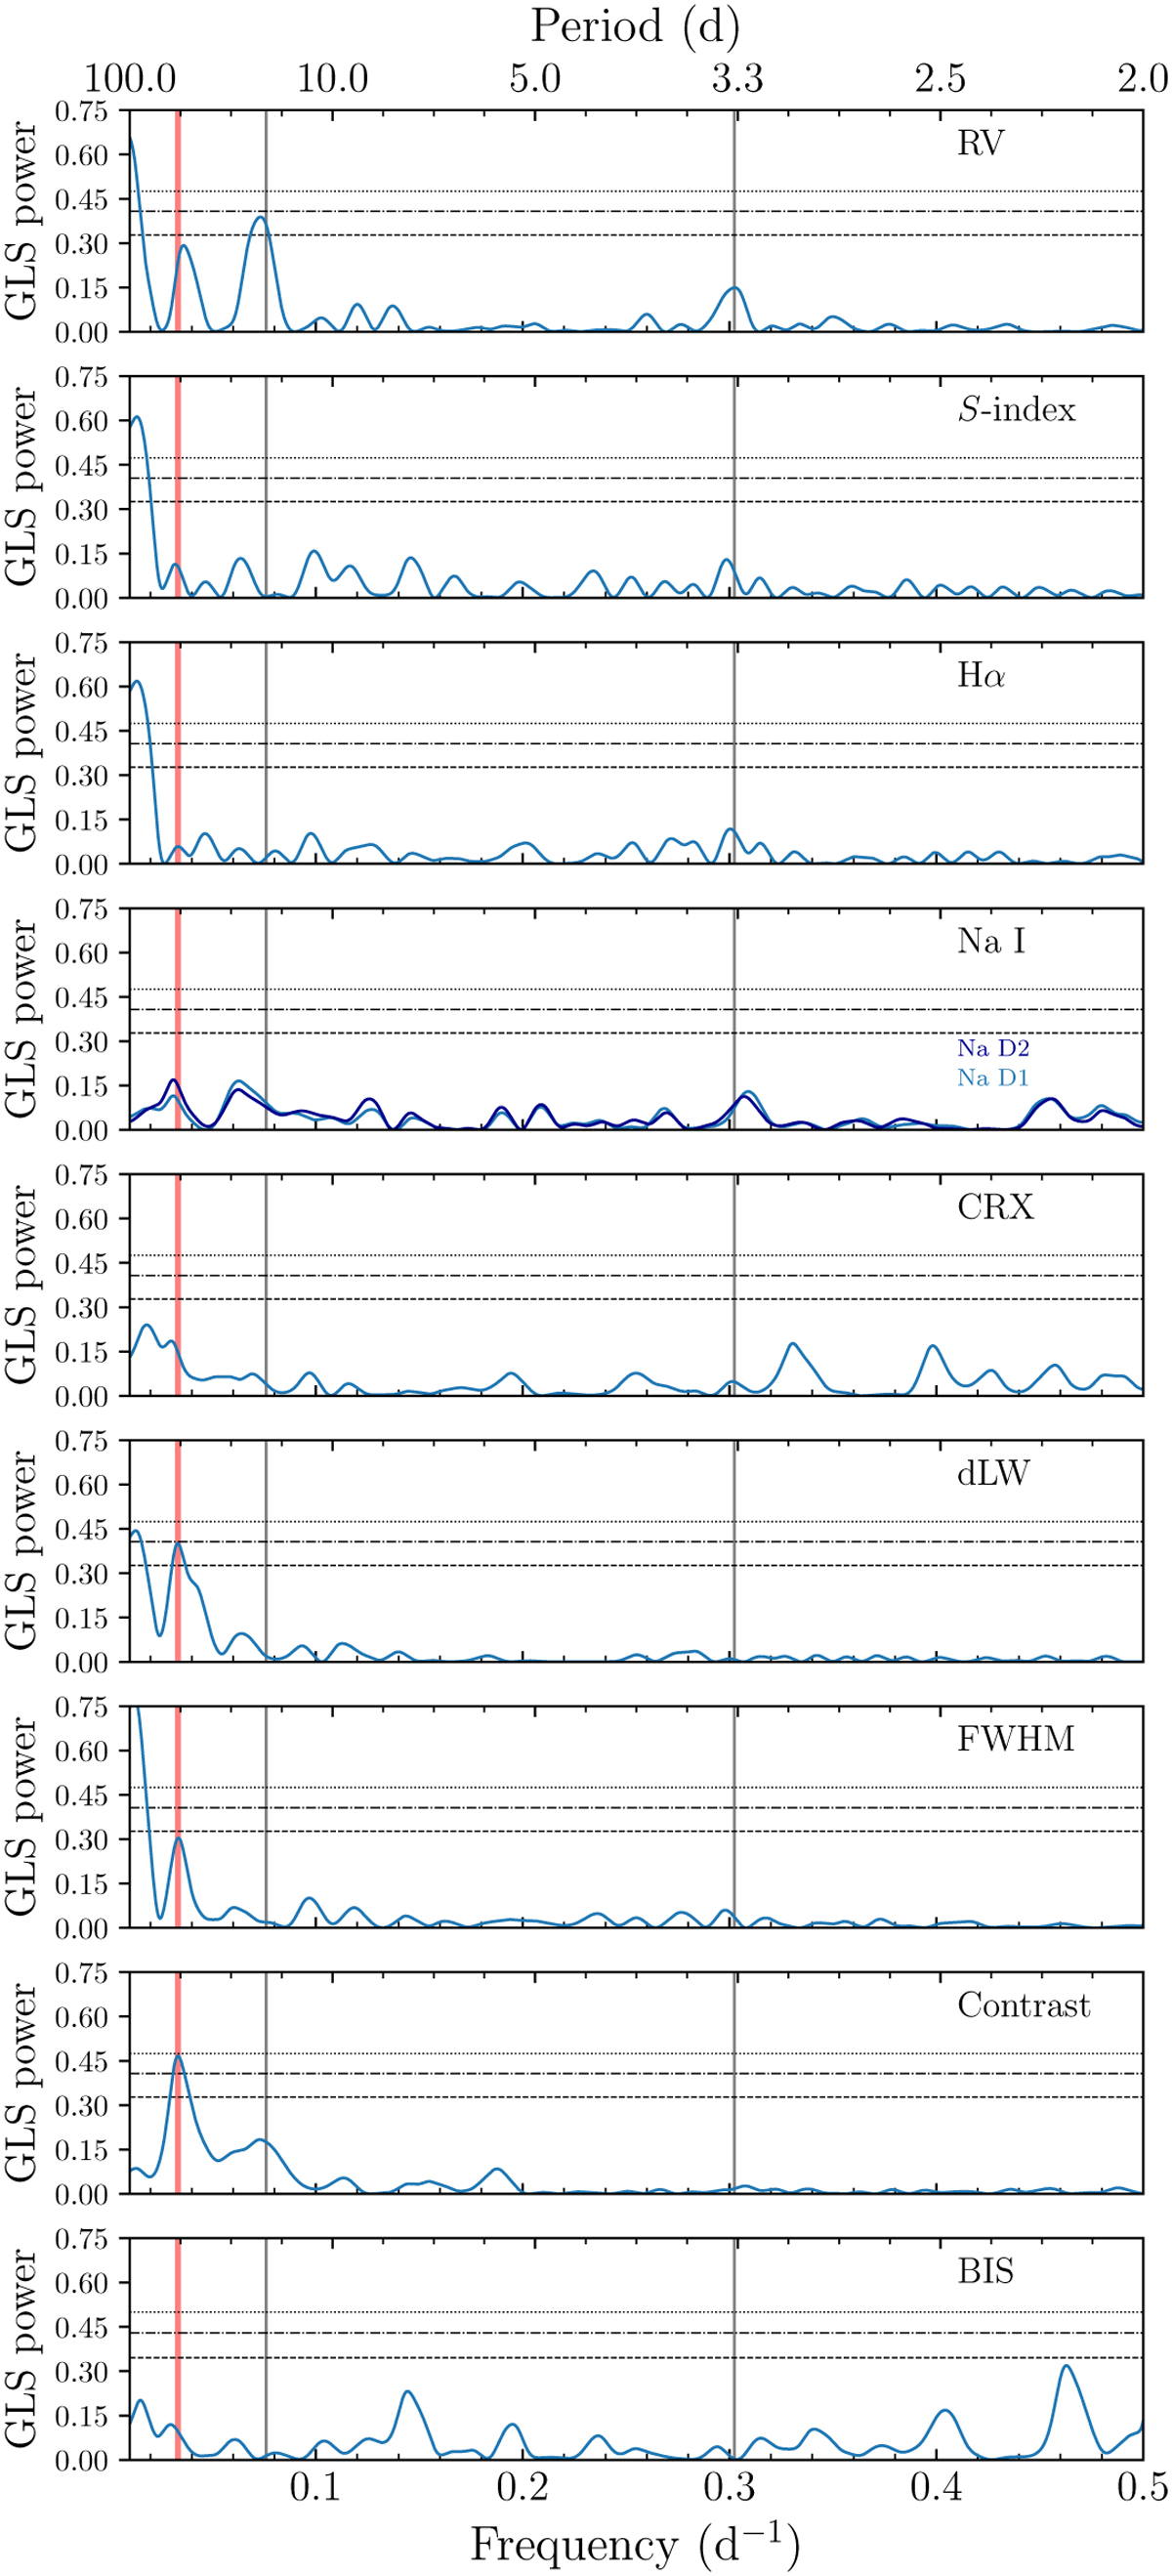
GLS periodogram of the ESPRESSO RVs and the spectroscopic activity indicators. The vertical grey lines indicate the transit-like signals with periods of 13.176 and 3.307 days. The vertical red line shows the frequency corresponding to the possible rotational period of the star at ~29 days. The dashed, dash-dotted, and dotted horizontal lines show the 10%, 1%, and 0.1% FAP levels, respectively.
Current usage metrics show cumulative count of Article Views (full-text article views including HTML views, PDF and ePub downloads, according to the available data) and Abstracts Views on Vision4Press platform.
Data correspond to usage on the plateform after 2015. The current usage metrics is available 48-96 hours after online publication and is updated daily on week days.
Initial download of the metrics may take a while.