Open Access
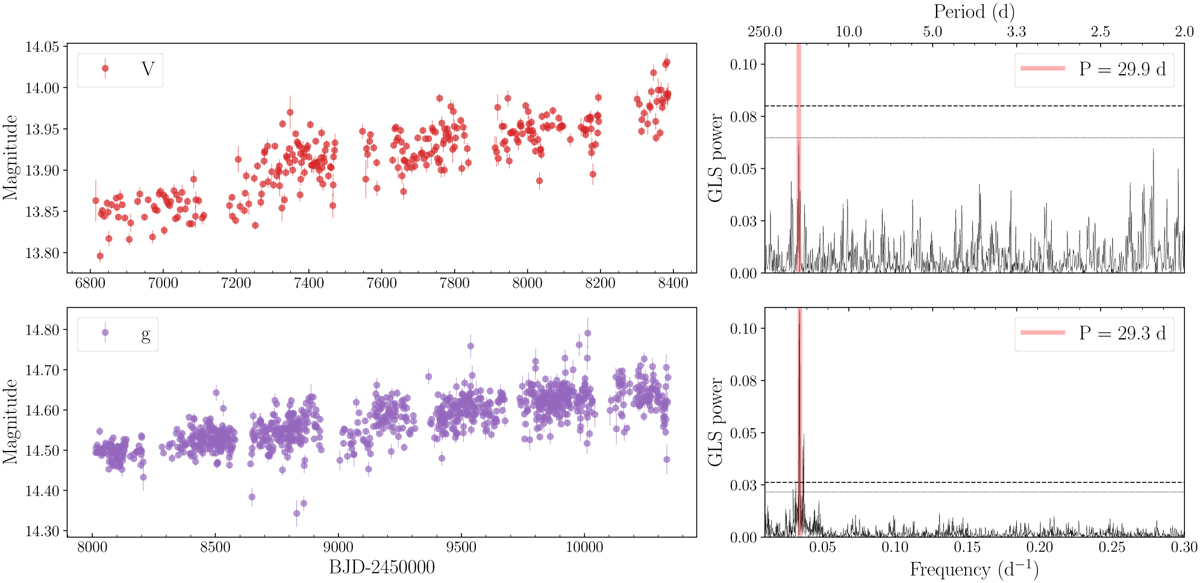
Fig. 3
Download original image
ASAS-SN photometry of TOI-406 in V and g filters. Right panel: GLS periodogram of ASAS-SN photometry. The horizontal dashed and dotted lines represent the FAP level of 1% and 10%, respectively. The vertical red line shows the most significant peak.
Current usage metrics show cumulative count of Article Views (full-text article views including HTML views, PDF and ePub downloads, according to the available data) and Abstracts Views on Vision4Press platform.
Data correspond to usage on the plateform after 2015. The current usage metrics is available 48-96 hours after online publication and is updated daily on week days.
Initial download of the metrics may take a while.