Fig. B.1
Download original image
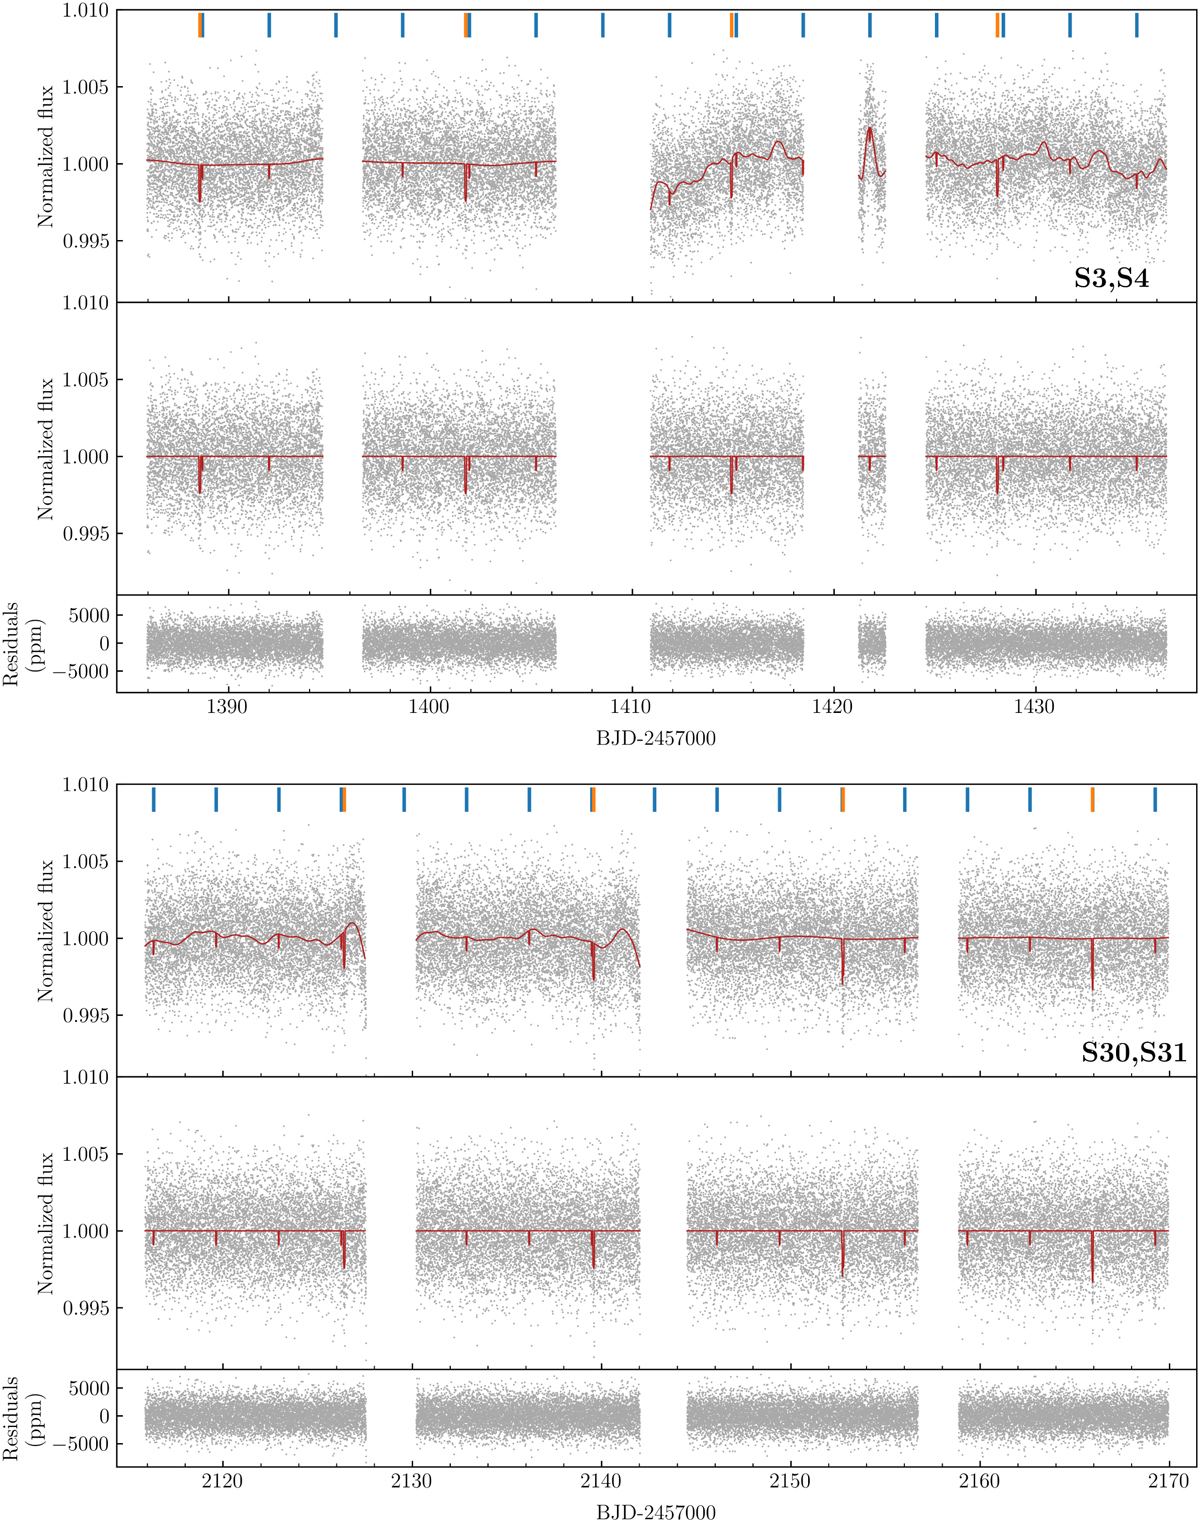
TESS sectors 3, 4 (top), and 30, 31 (bottom) PDCSAP light curves of TOI-406. In each figure, we show the best-fitting transit and Matérn-3/2 kernel GP model derived in Sect. 6 with a solid dark red line (top panel). The flattened light curve is shown in the central panel, after removing the GP component, with the solid red line showing the best-fitting model. The bottom panel shows the light curves residuals. The transits of planets b and c are highlighted with vertical orange and blue lines, respectively.
Current usage metrics show cumulative count of Article Views (full-text article views including HTML views, PDF and ePub downloads, according to the available data) and Abstracts Views on Vision4Press platform.
Data correspond to usage on the plateform after 2015. The current usage metrics is available 48-96 hours after online publication and is updated daily on week days.
Initial download of the metrics may take a while.