Fig. 16
Download original image
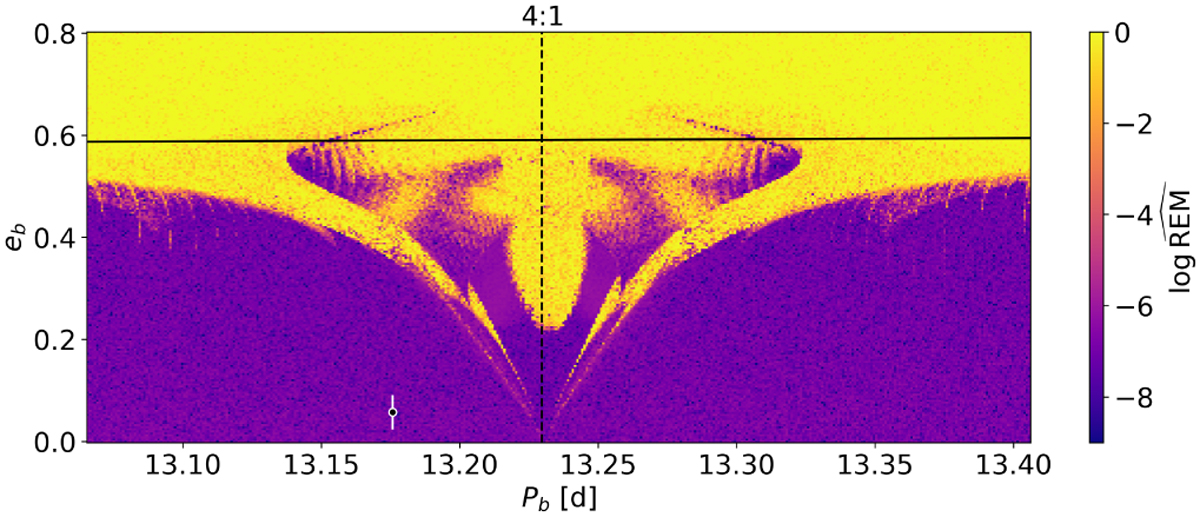
Dynamical map for the solution presented in Table 5 for a wide range of orbital periods and eccentricities of the outer planet b. Small values of the fast indicator log ![]() characterise regular (long-term stable) solutions, while chaotic solutions are indicated by log
characterise regular (long-term stable) solutions, while chaotic solutions are indicated by log ![]() approaching 0. The black line represents the so-called collision curve of orbits, defined by the condition: ab(1 + eb) = ac(1 − ec). The vertical dashed black line shows the centre of 4:1 mean-motion resonance. The filled black circle with a white rim indicates the position of the solution with uncertainties for the outer planet b. The resolution for the plot is 401 × 201 points.
approaching 0. The black line represents the so-called collision curve of orbits, defined by the condition: ab(1 + eb) = ac(1 − ec). The vertical dashed black line shows the centre of 4:1 mean-motion resonance. The filled black circle with a white rim indicates the position of the solution with uncertainties for the outer planet b. The resolution for the plot is 401 × 201 points.
Current usage metrics show cumulative count of Article Views (full-text article views including HTML views, PDF and ePub downloads, according to the available data) and Abstracts Views on Vision4Press platform.
Data correspond to usage on the plateform after 2015. The current usage metrics is available 48-96 hours after online publication and is updated daily on week days.
Initial download of the metrics may take a while.