Fig. 12
Download original image
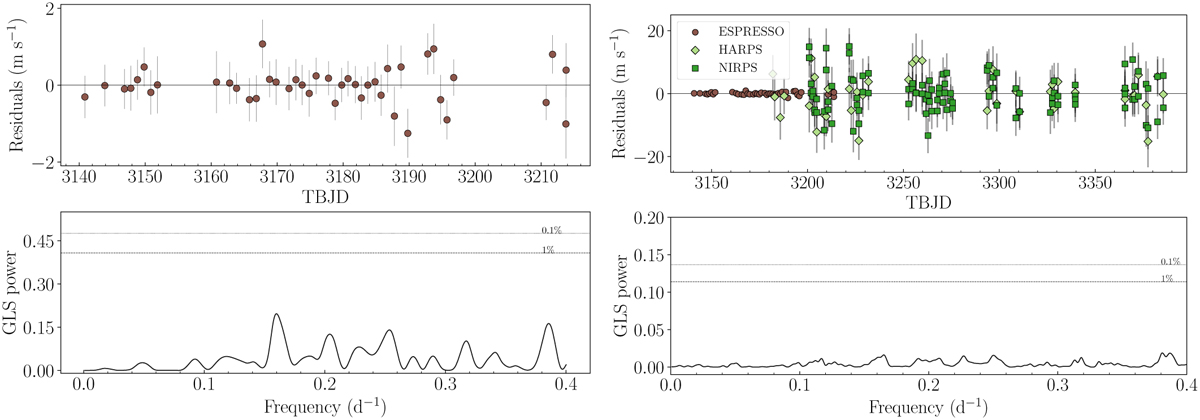
Time series and GLS periodogram of the RV residuals after the joint photometric and spectroscopic fit (Sect. 6). The left panel shows the results using ESPRESSO data only, while the right one includes all the available RV data. In the bottom panel, the dashed and dotted horizontal lines show the 1 and 0.1 per cent FAP level, respectively. No significant peaks are present in either periodogram.
Current usage metrics show cumulative count of Article Views (full-text article views including HTML views, PDF and ePub downloads, according to the available data) and Abstracts Views on Vision4Press platform.
Data correspond to usage on the plateform after 2015. The current usage metrics is available 48-96 hours after online publication and is updated daily on week days.
Initial download of the metrics may take a while.