Fig. 11
Download original image
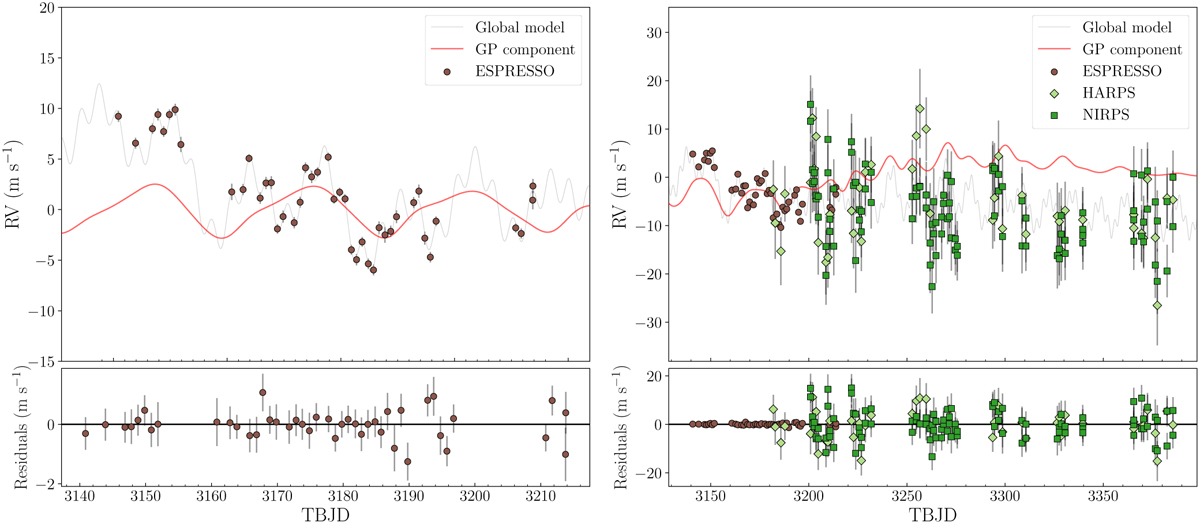
Global RV model from the joint photometric and RV analysis. The left panel shows the fit using ESPRESSO data only, while the right one shows the results when including all the available RV data. Time is expressed in the TESS barycentric Julian date (TBJD). The grey line shows the best-fit global model, while the red line highlights the quasi-period GP regression component. The reported error bars include the jitter term added in quadrature, and the residuals are shown in the bottom panel.
Current usage metrics show cumulative count of Article Views (full-text article views including HTML views, PDF and ePub downloads, according to the available data) and Abstracts Views on Vision4Press platform.
Data correspond to usage on the plateform after 2015. The current usage metrics is available 48-96 hours after online publication and is updated daily on week days.
Initial download of the metrics may take a while.