| Issue |
A&A
Volume 692, December 2024
|
|
|---|---|---|
| Article Number | A225 | |
| Number of page(s) | 10 | |
| Section | Atomic, molecular, and nuclear data | |
| DOI | https://doi.org/10.1051/0004-6361/202452170 | |
| Published online | 17 December 2024 | |
Cosmic-ray-induced chemical processes in CH3OH, CH3NH2, and CH3OH:CH3NH2 ices
Conventional and novel IR spectroscopic analysis with VIZSLA
1
Laboratory of Molecular Spectroscopy, Institute of Chemistry, ELTE Eötvös Loránd University,
PO Box 32,
1518
Budapest,
Hungary
2
Hevesy György PhD School of Chemistry, Institute of Chemistry, ELTE Eötvös Loránd University,
PO Box 32,
1518
Budapest,
Hungary
3
MTA-ELTE Lendület Laboratory Astrochemistry Research Group, Institute of Chemistry, ELTE Eötvös Loránd University,
PO Box 32,
1518
Budapest,
Hungary
4
Wigner Research Centre for Physics,
PO Box 49,
1525
Budapest,
Hungary
5
Centre for Astrophysics and Space Science, ELTE Eötvös Loránd University,
PO Box 32,
1518
Budapest,
Hungary
★ Corresponding author; This email address is being protected from spambots. You need JavaScript enabled to view it.
Received:
8
September
2024
Accepted:
13
November
2024
Abstract
Aims. Icy mantles on interstellar dust grains are considered key contributors to the chemical complexity of the interstellar medium (ISM). Gas-phase molecules in the ISM can adsorb onto these icy surfaces, where chemical reactions can be induced by ultraviolet (UV) or cosmic ray (CR) irradiation. The resulting molecules can subsequently desorb, thereby altering the composition of the gas phase in the ISM. Therefore, studying astrochemically relevant reactions within ices is essential for advancing our understanding of astrochemistry.
Methods. We conducted experiments with pure methanol (CH3OH), pure methylamine (CH3NH2), and CH3OH:CH3NH2 ices. To simulate CR effects, ices were irradiated with 5 keV electrons. We integrated the advantages of ice experiments and noble gas matrix experiments by performing two distinct investigations on each sample. During temperature-programmed desorption (TPD), chemical changes in the ice samples were monitored using Fourier transform infrared (FTIR) spectroscopy. In addition, the desorbing molecules were trapped in an Ar matrix through a following experiment. This TPD-matrix-isolation (TPD-MI) redeposition process enabled FTIR spectroscopic identification of the desorbed species.
Results. The results obtained from experiments with CH3OH and CH3NH2 ices are consistent with previous studies. Additionally, the TPD-MI redeposition process enabled the identification of several species previously not detected clearly and directly in pure CH3OH or CH3NH2 ices, including molecules such as HCOOH, HCN, and CH2CHNH. Our experiments with CH3OH:CH3NH2 mixtures revealed the formation of several nitrogen- and oxygen-containing organic species (CH3NHCH2OH, NH2CH2OH, NH2CH2CH2OH, and HNCO), which are potential precursors to prebiotic molecules in the ISM. Therefore, these experiments provide valuable insights into the chemical evolution in space.
Key words: astrochemistry / methods: laboratory: molecular / ISM: clouds / cosmic rays / ISM: molecules
© The Authors 2024
 Open Access article, published by EDP Sciences, under the terms of the Creative Commons Attribution License (https://creativecommons.org/licenses/by/4.0), which permits unrestricted use, distribution, and reproduction in any medium, provided the original work is properly cited.
This article is published in open access under the Subscribe to Open model. This email address is being protected from spambots. You need JavaScript enabled to view it. to support open access publication.
1 Introduction
To enhance our understanding of the chemical evolution of the Universe, it is essential to study the interstellar medium (ISM). The icy mantles on dust grains, which are key components of the ISM, are considered primary sites for chemical evolution and contributors to the chemical complexity of the ISM. These ices are of particular interest because they can give rise to the formation of interstellar complex organic molecules. Recent initiatives such as the IceAge project (McClure et al. 2023) and JWST Observations of Young protoStars (JOYS; Beuther et al. 2023; van Dishoeck et al. 2023) focus on examining astrophysical ices using observations from the James Webb Space Telescope (JWST). Thus, studying interstellar ices is pivotal for advancing our knowledge of the chemical processes that shape the Universe.
What role do icy mantles on interstellar dust grains play in the chemical evolution of the ISM? Molecules in the gas phase of the ISM can adsorb onto these icy mantles, forming ice layers on dust grains (Léger 1983; Whittet et al. 1996). Once frozen, these molecules can participate in various chemical reactions triggered by ultraviolet (UV) radiation, cosmic ray (CR) irradiation, or radical species (van Dishoeck & Blake 1998). The reaction products can then desorb from the ice mantles back into the gas phase, thereby altering the chemical composition of the ISM (Watson & Salpeter 1972; Leger et al. 1985; van Dishoeck & Blake 1998).
Two astrochemically significant molecules, methanol (CH3OH) and methylamine (CH3NH2), have garnered substantial interest due to their widespread presence in various astrophysical environments. CH3OH was first detected in the ISM by Ball et al. (1970) and has been observed in a wide range of interstellar environments, including diffuse and dark clouds (Requena-Torres et al. 2007; Cosentino et al. 2018; Spezzano et al. 2022), hot molecular cores, high-mass star-forming regions, low-mass protostars (Araya et al. 2008; Fontani et al. 2010; Maret et al. 2005; van Gelder et al. 2022), and comets (Bockelée-Morvan et al. 1991). Moreover, CH3OH is a crucial component of interstellar ices and has been observed in various astrophysical contexts, including recent detections by the JWST (Rocha et al. 2024). CH3NH2 was first detected in the ISM by Fourikis et al. (1974) and Kaifu et al. (1974). More recently, it has been identified in various sources, such as hot molecular cores, high-mass star-forming regions (Ohishi et al. 2019; Bøgelund et al. 2019; Nazari et al. 2022; Suzuki et al. 2023), comets (Altwegg et al. 2016), and the asteroid Ryugu (Naraoka et al. 2023). However, unlike CH3OH, CH3NH2 has not been detected either in low-mass protostars (Ligterink et al. 2018) or in interstellar ices. Both CH3OH and CH3NH2 are considered essential precursors for the formation of more complex interstellar molecules and biomolecules: they are thought to play an important role in the synthesis of carbohydrates (Hollis et al. 2000; Sorrell 2001; Maity et al. 2015) and the simplest amino acid, glycine (NH2CH2COOH; Sorrell 2001; Holtom et al. 2005; Lee et al. 2009; Danger et al. 2011). The prebiotic significance of CH3NH2 in amino acid formation is highlighted by the detection of both glycine and CH3NH2, a decarboxylated derivative of glycine, in comet 67P/Churyumov-Gerasimenko (Altwegg et al. 2016). These findings underscore the critical role of CH3OH and CH3NH2 in astrochemical processes. Consequently, the effects of UV and CR irradiation on CH3OH and CH3NH2 ices have been extensively investigated (Allamandola et al. 1988; Bernstein et al. 1995; Moore et al. 1996; Palumbo et al. 1999; Bennett et al. 2007; Jheeta et al. 2013; Sullivan et al. 2016; Holtom et al. 2005; Bossa et al. 2012; Frigge et al. 2018; Carrascosa et al. 2021).
When modeling irradiation-induced astrochemical processes, two main experimental approaches are commonly employed: one approach involves directly irradiating astrophysical analog ices (Öberg 2016; Cuppen et al. 2024), while the other involves preparing molecular species or intermolecular complexes in an inert, typically solid noble gas matrix, which is then irradiated (Feldman et al. 2016, 2021; Feldman 2023). Ice experiments more accurately replicate typical astrophysical conditions, including relevant temperatures and polarity. However, due to intermolecular interactions, the vibrational bands of molecules in ices are broad and often overlap in the infrared (IR) spectrum, complicating the identification of individual reaction products. Moreover, the reactions occurring within ices can be too complex to decipher without additional supporting experiments. In contrast, the matrix isolation (MI) method results in much sharper spectral bands due to negligible intermolecular interactions. This enhanced resolution facilitates the identification of species that are otherwise unidentifiable in ices due to overlapping bands, thereby simplifying the analysis of reaction pathways. Nevertheless, a significant limitation of the MI technique is its inability to mimic astrophysical conditions, as the temperature and polarity of noble gas matrices differ from those of ices.
In the present experimental study, we utilized the advantages of MI spectroscopy in a different and novel manner. The CR irradiation was modeled through the electron bombardment of pure CH3OH, as well as pure CH3NH2, and CH3OH:CH3NH2 ice mixtures. The desorption of the molecules from the icy mantles on interstellar grains was investigated using temperature-programmed desorption (TPD), where the ice samples were gradually heated from T = 3 K to T = 300 K. Two distinct experiments were conducted for each case. In the first experiment, the composition of the ice was continuously monitored by IR spectroscopy throughout the entire TPD process. In the second experiment, a TPD-MI redeposition process was applied: the sublimating species were captured in an Ar matrix at 16 K, and the chemical composition of the deposited matrix was analyzed by IR spectroscopy. This approach offers an alternative to the widely used quadrupole mass spectrometry (Ioppolo et al. 2013; Herczku et al. 2020), as well as to photoionization time-of-flight mass spectrometry (Jones & Kaiser 2013) and microwave- and millimeter-wave spectroscopic (Yocum et al. 2019) detection of desorbing species. As we demonstrate, this combined approach, implemented using the Versatile Ice Zigzag Sublimation Setup for Laboratory Astrochemistry (VIZSLA) experimental setup (Bazsó et al. 2021), significantly enhances our understanding of the chemistry of astrophysical ices that coat the surfaces of interstellar dust particles.
2 Materials and methods
The experiments were conducted in the ultra-high vacuum compatible chamber of the VIZSLA experimental setup (Bazsó et al. 2021), which achieves a base pressure of low ≈10−9 mbar when cooled. In the experiments, two samples were used: CH3OH and CH3NH2. CH3OH (VWR Chemicals Inc., 99.8%), being a colorless liquid, was placed in a small glass vial attached to the vacuum line, and its vapor was collected in a 0.5 L glass bulb coupled to the vacuum line. The gas bottle containing CH3NH2 (provided by an other research group of the university, its purity was checked by several methods, including MI-IR measurements) was connected to the vacuum line of the experimental setup, and the gas was collected in a 1 L glass bulb. A gold-coated silver wafer, which served as the “"primary” substrate in the ultra-high vacuum chamber and was mounted on the cold head of the primary cryostat (RDK-415D, Sumitomo Heavy Industries Inc.), was cooled to T = 3 K during the experiments. The sample molecules (CH3OH and CH3NH2) were deposited on this primary substrate. Sample vapors were introduced through two separate leak valves positioned ≈3 cm from the primary substrate, allowing the mixing of the samples before deposition. In the different experiments various ices were deposited. These included pure ices of CH3OH, and CH3NH2, as well as ice mixture of CH3OH:CH3NH2 (with a mixing ratio of CH3OH:CH3NH2 = 0.8 ± 0.2).
After deposition, the ices were bombarded with electrons using a tunable electron gun (Specs EQ 22), set to a kinetic energy of 5 keV (with a nominal emission current of 100 nA), with an electron irradiation spot size of 0.7 cm × 1.0 cm. Since electrons with 5 keV energy cannot penetrate deeply into the ices, several deposition–irradiation cycles were performed (5 cycles in the case of the CH3OH and CH3NH2 ices, and during the blank experiments, 7 cycles in the case of the CH3OH:CH3NH2 ice mixture), with each cycle involving 1 hour of electron irradiation. Multiple cycles were required to collect the sample molecules on the primary substrate due to significant concentration loss in the subsequent experimental steps. In each cycle, the thickness of the deposited ice was consistent: 220 nm for pure CH3OH, 600 nm for pure CH3NH2, and 400 nm for the CH3OH:CH3NH2 ice mixture, approximately. Prior to the cycles in every experiment, a base layer of the respective ice was deposited without electron irradiation (250, 1100, and 1400 nm, respectively). This ensured that the electrons were absorbed within the ice, preventing them from reaching the surface of the substrate; the penetration depth and the dose rate of the electrons were estimated using the CASINO program (Drouin et al. 2007) for every ice sample (see the details in Table S1).
Chemical changes were detected using a Bruker Invenio Fourier-transform infrared (FTIR) spectrometer operating in reflection-absorption mode with a liquid-N2-cooled mercury cadmium telluride detector. The spectral resolution in the case of the ice samples was set to 4 cm−1, and spectra were collected in the 4000–600 cm−1 spectral range. To monitor sample deposition, mid-infrared (MIR) spectra were collected every 15 seconds, averaging 8 scans. During electron bombardment, MIR spectra were obtained every minute by averaging 32 scans. Longer MIR spectra were collected between different experimental phases, averaging 256 scans each.
After the deposition–irradiation cycles, TPD was applied. The sample was heated from T = 3 K to T = 50 K at a rate of 2 K/min, and then to T = 300 K at a rate of 1 K/min. In every case, two sets of experiments were conducted. In the first set, chemical changes during the TPD were followed by recording MIR spectra (averaging 32 scans every minute). In other experiments, the sample was redeposited onto a second gold-coated silver wafer, referred to as the “secondary” substrate, which was cooled to T = 16 K by the secondary cryostat (CH202, Sumitomo Heavy Industries Inc.). During redeposition, the MI technique was applied. During the deposition–irradiation cycles, the two substrates were positioned above each other, separated by a gate valve. During TPD, the two substrates were aligned at the same height, facing each other (refer to Fig. S1; for more details, see Bazsó et al. 2021). As the sample molecules sublimated from the primary substrate, they mixed with Ar (Messer, 99.9999%), which was introduced into the vacuum chamber through a copper tube and a leak valve. This mixture then froze on the continuously cooled secondary wafer. Thus, during redeposition, the sample molecules were trapped in the Ar matrix. In order to prevent precursor molecules, which remain in the highest concentrations in the ice after electron bombardment, from entering the Ar matrix at too high concentrations and thereby suppressing the signals of other molecules, the redeposition process was initiated only at a temperature where the precursor molecules had already desorbed (at 175 K). At 175 K, the TPD process was paused, the gate valve was opened, and the primary and secondary substrate were aligned to face each other. The TPD was then restarted, continuing from 175 K to 300 K. As a result, the more volatile molecules were not trapped and are absent from the Ar matrix.
During TPD-MI redeposition, IR spectra (with a resolution of 1 cm−1, averaging 32 scans per minute) of the secondary substrate were recorded, which allowed the deposition of the matrix-isolated irradiation product to be monitored rather than the sublimation of the ice. The MI technique significantly enhanced the sensitivity and resolution of the recorded IR spectra, enabling the clear identification of species that were either unobservable in the ice or could only be ambiguously identified.
Blank experiments with CH3OH:CH3NH2 ice mixture were also carried out in which the deposition–irradiation cycles were replaced with deposition–waiting cycles. This allowed a clear assessment of the effects of electron bombardment.
Molecules identified in the experiments conducted on pure CH3OH ices.
3 Results and discussion
3.1 Experiments with pure ices
As this article primarily focuses on ice mixture experiments and given that the examined pure ices have been extensively studied in the literature, we briefly discuss the experimental results for single-component ices, highlighting the new insights provided by the previously unused TPD-MI redeposition process.
3.1.1 Experiments with pure CH3OH ices
In the case of pure CH3OH ice, several new absorption bands appeared in the IR spectra upon 5 keV electron bombardment at T = 3 K. These bands can be attributed to various species, namely H2ĊOH (1195 cm−1), formaldehyde (H2CO; 1724, 1505, and 1249 cm−1), HĊO (1843 cm−1), CO (2134 cm−1), methane (CH4; 1304 cm−1), CO2 (2340 cm−1), ethylene glycol (HOCH2CH2OH; 1091 cm−1), glycolaldehyde (HOCH2CHO; 1746 cm−1), methyl formate (CH3OCHO; 1724, 1160, and 920 cm−1), and dimethyl ether (CH3OCH3; 1160, 1091, and 920 cm−1; see Table 1, and for the corresponding difference spectrum, see Fig. S2). These identifications are in good agreement with previous literature data on the chemical changes of CH3OH ices upon high-energy (1 keV or 5 keV) electron bombardment (see our Table S2 and Bennett et al. 2007; Jheeta et al. 2013; Sullivan et al. 2016). It is important to note that some radicals cannot be directly identified from the IR spectrum of the irradiated ices due to the weak bands they exhibit in the IR spectra. However, they should be present based on the detection of the mentioned molecules. These radicals include ĊH3, CH3Ȯ, ȮH, and Ḣ. The generation of these radicals has already been proven by Gutiérrez-Quintanilla et al. (2021), who examined the UV photolytic behavior of CH3OH deposited in an Ar matrix using electron paramagnetic resonance spectroscopy.
As previously mentioned, following the deposition–irradiation cycles, TPD was performed. Between 115 and 120 K the shape of the bands of CH3OH ice in the IR spectra changed (see Fig. 1, lower panel, and Fig. S3). This indicates that, beside the possible ongoing chemical reactions, the crystallization of CH3OH occurred. Between 115 and 120 K, the amorphous ice transformed into a polycrystalline solid, as it was previously described by Luna et al. (2018). Moreover, during the TPD phase, the concentrations of several species changed (depicted in the lower panel of Fig. 1 and in Fig. S3 and S4). The IR spectra of the ice taken during the TPD process revealed that the absorption band at 1195 cm−1, corresponding to the H2ĊOH radical (Bennett et al. 2007), steadily diminished and disappeared by 160 K, indicating the complete depletion of this radical. Similarly, the HĊO radical concentration decreased until it was exhausted by 65 K. This behavior aligns with the findings of Bennett et al. (2005), which describe increased radical mobility and subsequent reactions upon heating.
In addition to change of the radical signatures in the IR spectra, other molecular species also displayed dynamic changes during the TPD process (refer to the lower panel of Fig. 1 and Figs. S3 and S4). The band at 1505 cm−1 indicated that the quantity of H2CO increased between 120 and 140 K, followed by a decrease until complete sublimation by 155 K. The quantities of CO and CO2 decreased continuously with the increase in the temperature, vanishing completely by 140 K and 145 K, respectively. CH4 exhibited a similar trend, with its band intensity steadily decreasing from the start of TPD and fully sublimating by 155 K. The band associated with HOCH2CH2OH, which overlaps with other species, showed an increase in intensity until 120 K, then a subsequent decrease until complete sublimation by 215 K. For HOCH2CHO, an increase in concentration was observed starting at 50 K, reaching a maximum before declining until 175 K. The exact temperature of maximum signal strength is challenging to pinpoint due to its overlapping bands at 1746 cm−1. CH3OCHO presented overlapping bands, complicating the analysis. However, all of its three bands (1724, 1160, 920 cm−1) increased until 120 K, and disappeared between 160 and 175 K. CH3OCH3, despite band overlap, showed a confident increase in concentration from the start of TPD until 120 K, followed by a decline until 160–175 K, as it is shown by its vibrational band at 1091 cm−1. This band persisted until 215 K, likely due to overlapping with the less volatile HOCH2CH2OH, which desorbs only at higher temperatures. The initial increase in the signal strength of different species can be explained by their formation through radical-radical recombinations as the mobility of radicals increases with temperature (Bennett et al. 2005). HOCH2CH2OH could form from the recombination of H2ĊOH with H2ĊOH, HOCH2CHO from H2ĊOH and HĊO, CH3OCHO from CH3Ȯ and HĊO, and CH3OCH3 from CH3Ȯ and ĊH3 reactions.
During the TPD-MI redeposition process, several distinct bands appeared in the IR spectra taken from the desorbed and redeposited species in Ar matrix (see Table 1 and the upper panel of Fig. 1). First of all, CH3OH appeared in the deposited matrix, as evidenced by its most important bands at 3666.7, 3004.8, 2955.4, 2847.6, 1473.9, and 1033.6 cm−1 (Han & Kim 1996). Notably, a subset of molecules identified in the irradiated CH3OH ice were also detected within the Ar matrix. Among these, CO exhibited characteristic bands at 2149.8 and 2137.7 cm−1, HOCH2CH2OH at 3672.2, 3634.8, 3632.9, 3624.4, 3618.6, 2885.4, 1383.7, 1346.7, 1286.7, 1269.0, 1164.1, 1158.6, 1073.9, 1043.7, 881.6, and 866.0 cm−1, CH3OCHO at 1777.7, 1746.9, 1239.8, 1164.1, 1158.6, 916.6, and 924.8 cm−1. These identifications were corroborated by reference to prior experimental data in Ar matrices (see our Tables S3–S5 and Leroi et al. 1964; Frei et al. 1977; Blom & Günthard 1981) and were further validated by the consistent changes in band intensities associated with each molecule (see the temporal evolution of the species in Fig. S5).
The emergence of different species in the Ar matrix occurred at distinct temperatures of the primary substrate (see Fig. 1, upper panel). CO began to appear at 225 K, while the concentration of HOCH2CH2OH increased from 195 K, peaking around 260 K as indicated by its most intense band at 1043.7 cm−1. The appearance of CH3OCHO was observed between 195 and 200 K, with its concentration increasing until approximately 250 K, particularly noted in its nonoverlapping bands at 1746.9 and 924.8 cm−1. A notable shift was observed between the initial decrease of the bands in the ice and their first appearance in the Ar matrix. This shift is likely attributable to the detection limits of the matrix: bands are observable only above a certain concentration threshold, below which they remain undetectable due to noise.
As the redeposition process started only after the sublimation of CH3OH, at 175 K, neither of the radicals, nor H2CO, CH4, HOCH2CHO, or CH3OCH3, were identified in the Ar matrix, consistent with their absence in the ice at 175 K (see Fig. 1, lower panel). CO and CO2 also completely desorbed from the ice by 175 K but remained present in the deposited Ar matrix. This can primarily be explained mainly by two factors: either these molecules were trapped in the ice phase and desorbed alongside the trapping molecules, or they were formed through the decomposition of less stable molecules leaving the primary substrate.
In addition to the molecules already identified from the IR spectrum of the irradiated ice, formic acid (HCOOH) was detected in the Ar matrix, with bands observed at 3731.4, 3639.9, 3553.2, and 1764.9 cm−1. These are consistent with the formerly reported IR bands of HCOOH in Ar matrix by Reva et al. (1994, refer to Table S6). These bands appeared at temperatures around 215–220 K (depicted in the upper panel of Fig. 1). The formation of HCOOH on CH3OH ices was theoretically modeled recently by Inostroza-Pino et al. (2024). However, although HCOOH can be a product of UV irradiation of CH3OH ice, as suggested by Öberg et al. (2009), its presence in the irradiated ices could only be tentatively identified. The TPD-MI redeposition process allowed the trapping and clear identification of HCOOH, providing direct evidence of its formation in the irradiated CH3OH ice. In the ice phase, HCOOH is unobservable either because hydrogen bonding broadens its vibrational bands, causing them to blend into the baseline, or because its bands overlap with those of other species.
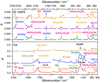 |
Fig. 1 IR spectra recorded during the TPD of pure CH3OH ice, zoomed in on key spectral bands. Lower panel: spectra of the ice at 3 K (red), 120 K (blue), and 160 K (brown). Upper panel: IR spectra of the desorbing species as deposited in an Ar matrix. The species were accumulated in the Ar matrix between 175 K and 220 K (green), 175 K and 260 K (purple), and 175 K and 300 K (orange). |
Molecules identified in the experiments conducted on pure CH3NH2 ices.
3.1.2 Experiments with pure CH3NH2 ices
During the electron irradiation of pure CH3NH2 ice, the following species were formed on the substrate: CH3ṄH and ĊH2NH2 (3239, 1653, and 1188 cm−1), methylene imine (CH2NH; 3145, 1636, 1402, 1188, and 1101 cm−1), CH4 (1302 cm−1), ammonia (NH3; 1072 cm−1), CH3NH3+ (1653, 1469, 1459, and 1013 cm−1), CN− (2081 cm−1), isocyanogen (CNCN; 2319, 2060, and 971 cm−1), and acetaldimine (CH3CHNH; 1680 and 1444 cm−1); see Table 2, and for the corresponding difference spectrum, see Fig. S6. Ethylamine (CH3CH2NH2; 3305 and 1101 cm−1) can also be identified in the ice, albeit with less certainty due to overlapping bands (refer to Table 2, and Fig. S6). The identification of these species was based on the experiments of Holtom et al. (2005), Bossa et al. (2012), and Carrascosa et al. (2021), our observations were in good agreement with these previous experiments (see Table S7). Considering the observed species, some radicals that cannot be directly detected should be present in the ice. The most important ones are ĊH3, ṄH2, ĊHNH, and Ḣ. CN− and CNCN, which are found in the ice, can be formed most likely through ĊN, HCN, or HNC. Considering this, HCN, HNC, or both likely also exist in the ice. The formation of HCN and HNC was previously discussed by Carrascosa et al. (2021), although they were unable to detect their presence in ices, observing them only in a UV-irradiated Xe matrix containing CH3NH2. It is worth mentioning that NH4+ formation was not observed during the experiments, likely due to its overlapping band with the precursor molecule, CH3NH2 (van Broekhuizen et al. 2004).
Following the deposition–irradiation cycles, TPD was performed. Similar to CH3OH, crystallization of the solid amorphous CH3NH2 was observed between 100 and 105 K (see the lower panel of Fig. 2, and Fig. S7), consistent with previous studies (Bossa et al. 2008a). Quantitative analysis of various species during the TPD was challenging due to the spectral overlap of their bands with those of CH3NH2. This difficulty was exacerbated by the crystallization of CH3NH2 ice, which significantly sharpened its spectral features. Nevertheless, several key observations were made. First, the band at 1302 cm−1 indicated a continuous decrease in CH4 concentration from the onset of TPD, with complete sublimation by 90 K (shown in Figs. S7 and S8). The concentration of NH3, another reaction product, increased between 75 and 100 K, peaking before diminishing until it completely vanished by 120 K (refer to Fig. 2, lower panel, and to Figs. S7 and S8). The initial increase in NH3 signal strength between 75 and 120 K may be attributed to the enhanced mobility of radicals at higher temperatures (Bennett et al. 2005), facilitating the NH3 formation via the ṄH2 + Ḣ reaction. However, tracking the quantity of these radicals by IR spectroscopy during TPD was not feasible due to the low molar absorption coefficient of ṄH2 and the fact that Ḣ has no IR absorption. The CN− band at 2081 cm−1 showed a continuous decrease, reaching zero at 190 K (shown in the lower panel of Fig. 2, and in Figs. S7 and S8). Meanwhile, CNCN concentrations, inferred from the 2060 cm−1 band, increased until 100 K before declining until disappearance by 210 K (see the lower panel of Fig. 2, and Figs. S7 and S8). The larger product molecule, CH3CHNH, exhibited an increase between 115 and 140 K, followed by a decrease until depletion at 210 K (depicted in the lower panel of Fig. 2, and in Figs. S7 and S8), as indicated by the band at 1680 cm−1. Due to overlapping bands, it was only possible to determine that CH3ṄH, ĊH2NH2, CH2NH, CH3NH3+, and CH3CH2NH2 had fully sublimated by 175 K, along with CH3NH2.
During the redeposition process, in addition to CH3NH2 (identified by its bands at 2991.6, 2967.7, 2820.2, 1621.2, 1480.9, 1463.8, 1052.3, and 796.7 cm−1 (Bohn & Andrews 1991)), several other species appeared in the Ar matrix (see Table 2 and the upper panel of Fig. 2). One of those molecules, CH3CHNH, which was previously identified in the ice, was confirmed by its bands at 1661.4, 1441.4, 1363.9, 1111.7, 1036.4, and 676.2 cm−1 (see our Table S8 and Stolkin et al. 1977). Another molecule is NH3, which has a band in the IR spectrum at 974.6 cm−1 (see our Table S9 and Bossa et al. 2008b).
Several other molecules that were not identified in the ice phase were observed in the Ar matrix (listed in Table 2 and depicted in Fig. 2, upper panel). These include the CH3CHNH isomer, CH2CHNH2, identified by its vibrational bands at 1661.4, 1455.4, 1075.7, 1036.4, 808.9, and 676.2 cm−1, consistent with the IR data from Ar matrix studies by Hamada et al. (1984, see our Table S10). Additionally, acetonitrile (CH3CN) and HCNC(H)CN were also identified in the noble gas matrix. CH3CN was observed through its spectral bands at 1441.4, 1036.4, and 916.4 cm−1, while HCNC(H)CN was identified at 729.1 and 712.0 cm−1, based on the prior work of Freedman & Nixon (1972) and Maier & Endres (2000), respectively (see Tables S11 and S12).
Another important molecule clearly identified in the Ar matrix was HCN, by its bands at 3306.3 and 720.8 cm−1 (see the upper panel of our Fig. 2, our Table S12, and King & Nixon 1968). As previously mentioned, HCN or HNC were expected to be present in the irradiated ice, but could not be directly detected. The deposited Ar matrix provides direct evidence of the formation of HCN. Its isomer, HNC, was not observed in the Ar matrix.
It is important to note that, similar to the experiments with pure CH3OH ice, some reaction products were not detectable in Ar matrix because they had already disappeared from the ice by the time the redeposition process commenced at 175 K. These species include various radicals, as well as CH4, CH2NH, CH3CH2NH2, CH3NH3+, CN−, and CNCN (refer to Table 2). An important factor to highlight is the possibility that ions, CH3NH3+ and CN−, are present in the ice as salts, which may dissociate during the TPD process. The decomposition of these salts could be a source of compounds such as HCN and NH3, which are observed in the Ar matrix.
Different species began to appear in the IR spectrum of molecules desorbed from the ice and redeposited into the Ar matrix at various temperatures (see the upper panel of Fig. 2). CH3CHNH was first observed in the matrix at 235 K, indicated by its distinct, nonoverlapping bands at 1363.9 and 1111.7 cm−1. This observation aligns well with the changes in CH3CHNH signal strength in the ice, where its concentration decreased between 140 and 210 K. Similar to experiments with pure CH3OH ice, a slight temperature shift is noted. NH3 was detected in the deposited Ar matrix around 235 K, as evidenced by its band at 974.6 cm−1. In the ice, the NH3 band disappeared by 120 K, which is lower temperature than 175 K, at which point the redeposition process was started. A possible explanation for its presence in the Ar matrix is that NH3 may have been trapped in the ice, then released into the gas phase as the trapping molecules sublimated. Another possible explanation is that NH3 is formed by the decomposition of other unstable species. Moreover, as previously mentioned, NH3 may be formed through the decomposition of salts during the TPD process (Kruczkiewicz et al. 2021). The signal strength of CH2CHNH2 began to increase around 185 K, as indicated by its distinct vibrational bands at 1455.4, 1075.7, and 808.9 cm−1. CH3CN has only one nonoverlapping band, observed in the IR spectrum at 916.4 cm−1, which started to appear around 245 K. Another molecule, HCNC(H)CN, emerged in the Ar matrix at 215 K, identified by its band at 729.1 cm−1. Finally, HCN began to appear at 190 K, as indicated by its band at 720.8 cm−1. Similarly to NH3, in addition to their direct formation in the ice during electron bombardment, CH2CHNH2, HCNC(H)CN, and HCN could also form through dissociation and decomposition of salts. The temporal evolution of the different species is shown in Fig. S9.
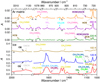 |
Fig. 2 IR spectra recorded during the TPD of pure CH3NH2 ice, zoomed in on key spectral bands. Lower panel: spectra of the ice at 3 K (red), 120 K (blue), and 160 K (brown). Upper panel: IR spectra of the desorbing species as deposited in an Ar matrix. The species were accumulated in the Ar matrix between 175 K and 220 K (green), 175 K and 260 K (purple), and 175 K and 300 K (orange). |
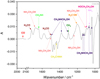 |
Fig. 3 Difference spectrum of electron bombarded CH3OH:CH3NH2 ice at 3 K, zoomed in on key spectral bands. The difference spectrum was obtained by subtracting the MIR spectrum recorded after the electron bombardment from the spectrum recorded after the deposition. |
3.2 Experiments with CH3OH:CH3NH2 ices
In the IR spectra of the ice mixture containing CH3OH and CH3NH2, several new bands appeared upon 5 keV electron irradiation. Similar to pure CH3OH ice, H2ĊOH (1196 cm−1), H2CO (1721, and 1499 cm−1), CO (2135 cm−1), CH4 (1302 cm−1), CO2 (2350 cm−1), and HOCH2CH2OH (1096 cm−1) were formed during the irradiation (see Fig. 3 and Table 3). As with pure CH3OH ice, some products cannot be directly observed but are inferred to exist in the ice at some point during the experiment based on the formed molecules. These unobserved species include ĊH3, ȮH, and Ḣ. Similarly to CH3NH2 pure ice, besides CH4 (1302 cm−1), NH3 (1064 cm−1), CH2NH (1641 cm−1), CH3CHNH (1438 cm−1), and CNCN (964 cm−1) were identified in the ice (see Fig. 3 and Table 3). Additionally, several radicals are likely present in the ice, facilitating the formation of the detected molecules. These are ĊH3, ṄH2, ĊH2NH2, CH3ṄH, and Ḣ.
It is important to note that not all reaction products found in pure CH3OH and pure CH3NH2 ices could be identified in the CH3OH:CH3NH2 ice mixture. In the mixture, HĊO, HOCH2CHO, CH3OCHO, or CH3OCH3 were not detected, although they are products of electron bombardment of CH3OH ice. The absence of HĊO can be explained by its non-primary formation from CH3OH. If its precursor species (H2ĊOH and H2CO) react with other molecules, HĊO cannot form in detectable quantities. This observation aligns with Bennett et al. (2007), who found that under conditions similar to our experiments (amorphous CH3OH ice at 11 K irradiated with 5 keV electrons) the quantity of the HĊO radical was more than an order of magnitude lower than that of the H2ĊOH radical. Similarly, without sufficient quantity of HĊO radicals, HOCH2CHO and CH3OCHO cannot form in detectable amounts. The non-observability of CH3OCH3 may be due to overlapping bands with those of precursor molecules. Considering this, if CH3OCH3 is present in the ice, the CH3O radical could also be present, as CH3OCH3 can form through the CH3Ȯ + ĊH3 reaction. Additionally, CH3NH3+, CN−, and CH3CH2NH2 were not identified, which differs from the case of pure CH3NH2 ice. However, CH3NH3+ and CH3CH2NH2 may still be present but have overlapping bands with the precursor molecules. The bands of the precursor molecules in the CH3OH:CH3NH2 ice mixture are broader than those in pure CH3OH or pure CH3NH2 ice.
During electron bombardment of the ice mixture, several spectral bands appeared that were absent in both the non-irradiated ice mixture and the irradiated pure CH3OH or pure CH3NH2 ices. One of the identified products corresponding to these bands is CH3NHCH2OH. This molecule exhibits bands at 2955, 2878, 1499, 1381, 1302, 1140, 1124, 1064, and 1035 cm−1 in the IR spectrum (depicted in Fig. 3). This identification aligns well with the experiments of Vinogradoff et al. (2013, see our Table S14), who investigated the thermal reactions of hydrogen lamp irradiated ice mixtures containing H2O, H2CO, and CH3NH2. Aminomethanol (NH2CH2OH) was identified as another reaction product by its characteristic vibrational bands in the IR spectra at 2955, 2881, 1680, 1499, 1249, and 1096 cm−1 (refer to Fig. 3). This finding is consistent with the previous experiments of Bossa et al. (2009, see our Table S15), who examined the thermal reactions of hydrogen lamp irradiated ices containing H2O, H2CO and NH3.
In a manner analogous to the experiments with pure ices, the crystallization of the amorphous ice mixture was observed between 90 and 120 K during TPD (shown in the lower panel of Fig. 4, and in Figs. S10 and S11). As with pure ices, the band shape changes hindered the precise identification of sublimation temperatures for various species. However, the following conclusions are definite. The quantities of H2CO and CO, identified by their bands at 1721 cm−1 and 2135 cm−1, respectively, decreased to zero by 115–120 K (see the lower panel of Fig. 4, and Fig. S10). CH4 concentration continuously decreased from the start of TPD until it completely disappeared by 115 K (depicted in the lower panel of Fig. 4, and in Figs. S10 and S11). The signal strength of another reaction product, HOCH2CH2OH, monitored by its band at 1096 cm−1, decreased until it was depleted by 150 K (see Fig. 4, lower panel, and Figs. S10 and S11). For N-bearing species, the signal strength of CH3CHNH, tracked by its bands at 1680 and 1438 cm−1, continuously decreased during TPD, reaching zero at 190 K (see the lower panel of Fig. 4, and Figs. S10 and S11). CNCN was completely depleted by 140 K, as it is shown in the lower panel of Fig. 4, and in Fig. S10. The signal strength of CH3NHCH2OH, observed through its bands at 1381, 1140, 1124, and 1035 cm−1, decreased until it depleted by 190 K, which is depicted in the lower panel of Fig. 4, and in Figs. S10 and S11 (its other bands overlapped with those of other species). The quantities of H2ĊOH radical, NH3, CH2NH, and NH2CH2OH could not be monitored during the TPD due to the overlapping of their vibrational bands with the bands of the precursor molecules or with other species.
In the TPD-MI redeposition experiments, several bands appeared in the IR spectra of the formed Ar matrix (see the upper panel of Fig. 4), which are listed in Table S16. The precursor molecules, CH3OH and CH3NH2 were detected based on the characteristic vibrational bands at specific IR frequencies in Ar matrix. CH3OH exhibited vibrational bands at 3666.2, 3004.6, 2955.4, 2847.9, 1474.3, and 1033.8 cm−1 (Han & Kim 1996), while CH3NH2 showed bands at 2991.8, 2967.2, 2820.5, 1623.4, 1480.9, 1464.8, 1052.8, and 796.6 cm−1 (Bohn & Andrews 1991). Several additional species were trapped in the Ar matrix (see Fig. 4, upper panel), some of which were also present in the ice phase, including CO (at 2149.6 and 2137.2 cm−1; Dubost 1976), NH3 (at 974.2 cm−1; Bossa et al. 2008b), CH2NH (at 1646.6, 1454.3, 1342.2, 1124.9, 1060.6, 1056.3 cm−1; Jacox & Milligan 1975), and CH3CHNH (at 1356.6, 1110.4, 1036.9, 675.7 cm−1); see Tables S3, S9, S17, and S8, respectively. According to their bands, they started to appear in the matrix at 230 K, 245 K, 200 K, and 220 K, respectively. It should be noted that, as previously mentioned, the spectra recorded from the ice phase indicate that CO was depleted in the ice at 120 K. There are two possible explanations for its presence in the deposited Ar matrix. First, a small amount of CO could have been trapped in the ice and only sublimated at higher temperatures, along with the molecules that trapped it. Second, CO could have formed through the decomposition of unstable molecules. Additionally, several species were identified in the matrix that were not observable in the ice phase. These included HCOOH, HCN, and HCNC(H)CN. HCOOH was characterized by its IR bands at 3731.3 and 1764.2 cm−1 (Reva et al. 1994), HCN by a band at 720.9 cm−1 (King & Nixon 1968), and HCNC(H)CN by bands at 729.3 and 712.4 cm−1 (see our Tables S6, S13, and S12, respectively, and Maier & Endres 2000). These species were also observed in experiments with pure CH3OH or CH3NH2 ices. HCOOH was first observed in the IR spectra at 275 K. The other two molecules, HCN and HCNC(H)CN, were detected at lower temperatures: HCN at 205 K, and HCNC(H)CN at 210 K, based on their distinct bands at 720.9 and 729.3 cm−1, respectively.
Furthermore, molecules such as ethanolamine (NH2CH2CH2OH) were observed, which were absent in pure ice experiments. This molecule could potentially form through the recombination of H2ĊOH and H2ĊNH2 radicals, and displayed IR bands at 3666.3, 3555.0, 3548.2, and 3533.9 cm−1, consistent with the Ar-matrix IR spectroscopic data taken by Räsänen et al. (1982, see our Table S18). NH2CH2CH2OH started to be observable in the Ar matrix during the redeposition process approximately from 185–190 K (depicted in Fig. 4, upper panel, and Fig. S12).
Isocyanic acid (HNCO) is another molecule that was not observed in the pure ice experiments but was detected in the Ar matrix after the TPD-MI redeposition process. It was identified by a vibrational band at 2259.7 cm−1 (refer to our Table S19 and Teles et al. 1989) and first appeared in the IR spectra at 280 K (shown in the upper panel of Fig. 4 and Fig. S12). The formation of HNCO is consistent with the findings of Jheeta et al. (2013), where CH3OH- and NH3-containing ices subjected to 1 keV electron bombardment at 30 K led to the production of HNCO.
Conversely, certain species such as the radicals H2CO, CH4, CNCN, HOCH2CH2OH, and NH2CH2OH were not detected in the Ar matrix. This absence is attributed to the redeposition process starting only at 175 K, as discussed in more detail in Sect. 2. At this temperature, the quantities of these species in the ice were negligible, preventing their transfer to the secondary substrate. Similarly, CH3NHCH2OH was not detected in the Ar matrix. At the beginning of the redeposition process (at 175 K), CH3NHCH2OH was still present in the ice phase. However, by 190 K, it had depleted, suggesting that the amount of the remaining CH3NHCH2OH in the ice was insufficient to be detected in the Ar matrix.
Molecules identified in the experiments conducted on CH3OH:CH3NH2 ices.
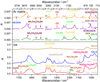 |
Fig. 4 IR spectra recorded during the TPD of CH3OH:CH3NH2 ice, zoomed in on key spectral bands. Lower panel: Spectra of the ice at 3 K (red), 120 K (blue), and 160 K (brown). Upper panel: IR spectra of the desorbing species as deposited in an Ar matrix. The species were accumulated in the Ar matrix between 175 K and 220 K (green), 175 K and 260 K (purple), and 175 K and 300 K (orange). |
4 Astrophysical implications
The experimental results demonstrate that the TPD-MI redeposition process is an effective method for directly identifying species in the gas phase during TPD that may not be observed, or only indirectly detected, in the ice phase. The TPD-MI is a good alternative to mass spectrometric techniques and the microwave- and millimeter-wave spectroscopic detection of desorbing, gas-phase species, as it does not involve fragmentation and the Ar MI technique has extensive data in the literature, which helps with the identification of the species. Despite the significant loss of molecules during the redeposition process, which has an efficiency of 8–20% (Bazsó et al. 2021), molecules can still be observed in the Ar matrix, where the bands are sharper and have higher intensity and signal-to-noise ratio than in the ice phase. The sensitivity can also be enhanced by “collecting” the reaction products on the primary substrate through multiple deposition–irradiation cycles (see details in Sect. 2). Since the trapping of molecules in the Ar matrix only occurred after the sublimation of precursor molecules (to prevent ice formation on the upper substrate, as discussed in more detail in Sect. 2), any reaction products formed at temperatures below the sublimation point of the precursors (for CH3OH and CH3NH2, this is 175 K), such as radicals or those that fully desorb from the substrate before reaching this temperature, could not be detected in the Ar matrix. However, the redeposition process can begin at the start of TPD if the temperature increase is slower than the applied 1 K/min (a lower rate of temperature increase improves the efficiency of trapping within the Ar matrix and the isolation of the molecules; therefore, it results in better resolution and a better signal-to-noise ratio). In this case, even volatile species could be trapped in the Ar matrix. These types of experiments will be tested using the VIZSLA setup in the future, although they require a significant amount of time, effort, and work.
The astrophysical significance of the conducted experiments is evident from the fact that not only the sample molecules (CH3OH and CH3NH2) but also many of the reaction products (see Table 4) have been detected in the ISM. Highlighting the N- and O-bearing complex organic molecules, HNCO was first observed by Snyder & Buhl (1972), while NH2CH2CH2OH was only recently detected by Rivilla et al. (2021). However, CH3NHCH2OH and NH2CH2OH have not been found in the ISM yet. Given that these molecules were formed during the experiments, it is possible that they exist in regions of the ISM where CH3OH and CH3NH2 are present under electron irradiation together. Future interstellar surveys might focus on detecting them in such environments.
In summary, the experiments, particularly with the innovative redeposition technique, unveiled a fascinating array of species that could significantly enhance the chemical diversity of the ISM. These findings, especially with the application of the novel approach of redeposition, offer fresh insights into the chemical evolution of the ISM. As a wide range of molecules can be identified using the redeposition technique, experiments involving the redeposition process may inform future interstellar searches and surveys for potential interstellar molecules. The formation of various N- and O-rich organic molecules from the ice mixtures highlights how icy mantles on dust grains may drive the complexity of interstellar chemistry. Ultimately, the studies revealed that CH3OH and CH3NH2, two crucial molecules in the ISM, could play a pivotal role in the genesis of prebiotic molecule precursors, bridging the gap between cosmic chemistry and the origins of life.
5 Conclusions
Our experiments explored the chemical changes induced by CR irradiation on the icy mantles of interstellar grains, a process believed to be a key driver in increasing the chemical complexity of the gas phase within the ISM. To simulate the effects of CRs, we subjected ices of CH3OH, CH3NH2, and mixed CH3OH:CH3NH2 to 5 keV electron bombardment. Following this, the TPD technique was employed to analyze the resulting chemical changes in both the ice and gas phase. Two distinct experimental approaches were employed: in the first, IR spectra of the processed ice were recorded directly when heated; in the second, the novel TPD-MI redeposition process was implemented. This process involved trapping and accumulating the desorbed molecules in an Ar matrix, significantly enhancing the identification of specific chemical species desorbing into the gas phase.
The experimental results for both pure CH3OH and pure CH3NH2 ices were consistent with findings from previous studies, confirming the formation of the same reaction products. Specifically, for pure CH3OH ice, the electron irradiation led to the generation of several species, including H2ĊOH, H2CO, HĊO, CO, CH4, CO2, HOCH2CH2OH, HOCH2CHO, CH3OCHO, and CH3OCH3 (see our Tables 1 and 4 and Bennett et al. 2007; Jheeta et al. 2013; Sullivan et al. 2016). In the case of pure CH3NH2 ice, the bombardment produced CH3 ṄH, ĊH2NH2, CH2NH, CH4, NH3, CH3NH3+, CN−, CNCN, CH3CHNH, and CH3CH2NH2 (refer to our Tables 2 and 4 and Holtom et al. 2005; Bossa et al. 2012; Carrascosa et al. 2021). The TPD-MI redeposition process uncovered the formation of several other molecules. In the Ar matrix containing pure CH3OH, the presence of CO, HOCH2CH2OH, CH3OCHO, and HCOOH was detected (see Tables 1 and 4). For CH3NH2, molecules such as NH3, CH3CHNH, CH2CHNH2, CH3CN, HCNC(H)CN, and HCN were identified within the Ar matrix (refer to Tables 2 and 4).
Finally, experiments were also performed on a CH3OH:CH3NH2 ice mixture. In this case, electron bombardment of the ice resulted in the formation of several compounds (which are listed in Tables 3 and 4), including H2ĊOH, H2CO, CH4, CO2, HOCH2CH2OH, NH3, CH2NH, CH3CHNH, CNCN, CH3NHCH2OH, and aminomethanol (NH2CH2OH). In the Ar matrix, which was formed during the TPD of the ice mixture, CO, NH3, HCOOH, HCN, CH3CHNH, HCNC(H)CN, ethanolamine (NH2CH2CH2OH), and isocyanic acid (HNCO) were trapped (see Tables 3 and 4). Among the identified molecules, CH3NHCH2OH, NH2CH2OH, NH2CH2CH2OH, and HNCO stand out for their unique combination of N and O atoms. These organic compounds could play a pivotal role in the formation of essential prebiotic molecules, such as amino acids (Sorrell 2001; Holtom et al. 2005; Lee et al. 2009; Danger et al. 2011). This discovery underscores the significance of these molecules in the cosmic chemistry that could ultimately contribute to the origins of life.
Molecules identified during the experiments and their detection in the ISM.
Data availability
The data underlying this article are available in the article and in its online supplementary material (https://zenodo.org/records/14095495).
Acknowledgements
The research work was funded by the Hungarian Scientific Research Fund (OTKA K143196) and the NKFIH excellence grant (TKP2021-NKTA-64). B. K. and A. S. were supported by the “ÚNKP-23-3 New National Excellence Program” of the Ministry for Culture and Innovation from the source of the National Research, Development and Innovation Fund. B. K. was also supported by the “DKOP-23 Doctoral Excellence Program” of the Ministry for Culture and Innovation from the source of the National Research, Development and Innovation Fund. S. G. was supported by the “Bolyai Scholarship” of the Hungarian Academy of Sciences and by the “ÚNKP-23-5 New National Excellence Program” of the Ministry for Culture and Innovation from the source of the National Research, Development and Innovation Fund. We are greatful for István Jalsovszky for providing CH3NH2 for the experiments. We acknowledge the valuable contribution of the anonymous referee, whose constructive suggestions significantly improved the quality and clarity of this article.
References
- Agúndez, M., Cernicharo, J., Guélin, M., et al. 2010, A&A, 517, L2 [NASA ADS] [CrossRef] [EDP Sciences] [Google Scholar]
- Agúndez, M., Marcelino, N., & Cernicharo, J. 2018, ApJ, 861, L22 [Google Scholar]
- Allamandola, L. J., Sandford, S. A., & Valero, G. J. 1988, Icarus, 76, 225 [Google Scholar]
- Altwegg, K., Balsiger, H., Bar-Nun, A., et al. 2016, Sci. Adv., 2, e1600285 [NASA ADS] [CrossRef] [Google Scholar]
- Araya, E., Hofner, P., Kurtz, S., Olmi, L., & Linz, H. 2008, ApJ, 675, 420 [NASA ADS] [CrossRef] [Google Scholar]
- Ball, J. A., Gottlieb, C. A., Lilley, A. E., & Radford, H. E. 1970, ApJ, 162, L203 [NASA ADS] [CrossRef] [Google Scholar]
- Bazsó, G., Csonka, I. P., Góbi, S., & Tarczay, G. 2021, Rev. Sci. Instrum., 92, 124104 [CrossRef] [Google Scholar]
- Bennett, C. J., Jamieson, C. S., Osamura, Y., & Kaiser, R. I. 2005, ApJ, 624, 1097 [Google Scholar]
- Bennett, C. J., Chen, S.-H., Sun, B.-J., Chang, A. H. H., & Kaiser, R. I. 2007, ApJ, 660, 1588 [NASA ADS] [CrossRef] [Google Scholar]
- Bernstein, M. P., Sandford, S. A., Allamandola, L. J., Chang, S., & Scharberg, M. A. 1995, ApJ, 454, 327 [NASA ADS] [CrossRef] [Google Scholar]
- Beuther, H., van Dishoeck, E. F., Tychoniec, L., et al. 2023, A&A, 673, A121 [NASA ADS] [CrossRef] [EDP Sciences] [Google Scholar]
- Blom, C. E., & Günthard, H. H. 1981, Chem. Phys. Lett., 84, 267 [NASA ADS] [CrossRef] [Google Scholar]
- Bockelée-Morvan, D., Colom, P., Crovisier, J., Despois, D., & Paubert, G. 1991, Nature, 350, 318 [NASA ADS] [CrossRef] [Google Scholar]
- Bøgelund, E. G., McGuire, B. A., Hogerheijde, M. R., van Dishoeck, E. F., & Ligterink, N. F. W. 2019, A&A, 624, A82 [EDP Sciences] [Google Scholar]
- Bohn, R. B., & Andrews, L. 1991, J. Phys. Chem., 95, 9707 [Google Scholar]
- Bossa, J.-B., Borget, F., Duvernay, F., Theulé, P., & Chiavassa, T. 2008a, J. Phys. Chem. A, 112, 5113 [NASA ADS] [CrossRef] [Google Scholar]
- Bossa, J.-B., Duvernay, F., Theulé, P., Borget, F., & Chiavassa, T. 2008b, Chem. Phys., 354, 211 [NASA ADS] [CrossRef] [Google Scholar]
- Bossa, J. B., Theule, P., Duvernay, F., & Chiavassa, T. 2009, ApJ, 707, 1524 [Google Scholar]
- Bossa, J.-B., Borget, F., Duvernay, F., et al. 2012, Aust. J. Chem., 65, 129 [CrossRef] [Google Scholar]
- Brown, R. D., Crofts, J. G., Gardner, F. F., et al. 1975, ApJ, 197, L29 [NASA ADS] [CrossRef] [Google Scholar]
- Carrascosa, H., González Díaz, C., Muñoz Caro, G. M., Gómez, P. C., & Sanz, M. L. 2021, MNRAS, 506, 791 [NASA ADS] [CrossRef] [Google Scholar]
- Cheung, A. C., Rank, D. M., Townes, C. H., Thornton, D. D., & Welch, W. J. 1968, Phys. Rev. Lett., 21, 1701 [NASA ADS] [CrossRef] [Google Scholar]
- Churchwell, E., & Winnewisser, G. 1975, A&A, 45, 229 [NASA ADS] [Google Scholar]
- Cosentino, G., Jiménez-Serra, I., Henshaw, J. D., et al. 2018, MNRAS, 474, 3760 [NASA ADS] [Google Scholar]
- Cuppen, H. M., Linnartz, H., & Ioppolo, S. 2024, Annu. Rev. Astron. Astrophys., 62, 243 [Google Scholar]
- Danger, G., Borget, F., Chomat, M., et al. 2011, A&A, 535, A47 [NASA ADS] [CrossRef] [EDP Sciences] [Google Scholar]
- d’Hendecourt, L. B., & Jourdain de Muizon, M. 1989, A&A, 223, L5 [Google Scholar]
- Drouin, D., Couture, A. R., Joly, D., et al. 2007, Scanning, 29, 92 [CrossRef] [PubMed] [Google Scholar]
- Dubost, H. 1976, Chem. Phys., 12, 139 [NASA ADS] [CrossRef] [Google Scholar]
- Feldman, V. I. 2023, Int. J. Mol. Sci., 24, 14510 [CrossRef] [Google Scholar]
- Feldman, V. I., Ryazantsev, S. V., Saenko, E. V., Kameneva, S. V., & Shiryaeva, E. S. 2016, Radiat. Phys. Chem., 124, 7 [NASA ADS] [CrossRef] [Google Scholar]
- Feldman, V. I., Ryazantsev, S. V., & Kameneva, S. V. 2021, Russ. Chem. Rev., 90, 1142 [NASA ADS] [CrossRef] [Google Scholar]
- Fontani, F., Cesaroni, R., & Furuya, R. 2010, A&A, 517, A56 [NASA ADS] [CrossRef] [EDP Sciences] [Google Scholar]
- Fourikis, N., Takagi, K., & Morimoto, M. 1974, ApJ, 191, L139 [Google Scholar]
- Freedman, T. B., & Nixon, E. R. 1972, Spectrochim. Acta Part A: Mol. Spectrosc., 28, 1375 [NASA ADS] [CrossRef] [Google Scholar]
- Frei, H., Ha, T.-K., Meyer, R., & Gūnthard, H. H. 1977, Chem. Phys., 25, 271 [CrossRef] [Google Scholar]
- Frigge, R., Zhu, C., Turner, A. M., et al. 2018, ApJ, 862, 84 [NASA ADS] [CrossRef] [Google Scholar]
- Godfrey, P. D., Brown, R. D., Robinson, B. J., & Sinclair, M. W. 1973, ApJ, 13, L119 [Google Scholar]
- Gutiérrez-Quintanilla, A., Layssac, Y., Butscher, T., et al. 2021, MNRAS, 506, 3734 [CrossRef] [Google Scholar]
- Hamada, Y., Hashiguchi, K., Tsuboi, M., Koga, Y., & Kondo, S. 1984, J. Mol. Spectrosc., 105, 93 [NASA ADS] [CrossRef] [Google Scholar]
- Han, S. W., & Kim, K. 1996, J. Phys. Chem., 100, 17124 [Google Scholar]
- Herczku, P., Juhász, Z., Kovács, S. T., et al. 2020, Ion and electron impact studies on astrophysically relevant ices: a new laboratory at Atomki in Debrecen, Tech. rep., Copernicus Meetings [Google Scholar]
- Hollis, J. M., Lovas, F. J., & Jewell, P. R. 2000, ApJ, 540, L107 [Google Scholar]
- Hollis, J. M., Lovas, F. J., Jewell, P. R., & Coudert, L. H. 2002, ApJ, 571, L59 [NASA ADS] [CrossRef] [Google Scholar]
- Holtom, P. D., Bennett, C. J., Osamura, Y., Mason, N. J., & Kaiser, R. I. 2005, ApJ, 626, 940 [Google Scholar]
- Inostroza-Pino, N., Godwin, O. E., Mardones, D., & Ge, J. 2024, A&A, 688, A140 [NASA ADS] [CrossRef] [EDP Sciences] [Google Scholar]
- Ioppolo, S., Fedoseev, G., Lamberts, T., Romanzin, C., & Linnartz, H. 2013, Rev. Sci. Instrum., 84, 073112 [NASA ADS] [CrossRef] [Google Scholar]
- Jacox, M. E., & Milligan, D. E. 1975, J. Mol. Spectrosc., 56, 333 [NASA ADS] [CrossRef] [Google Scholar]
- Jheeta, S., Domaracka, A., Ptasinska, S., Sivaraman, B., & Mason, N. J. 2013, Chem. Phys. Lett., 556, 359 [NASA ADS] [CrossRef] [Google Scholar]
- Jones, B. M., & Kaiser, R. I. 2013, J. Phys. Chem. Lett., 4, 1965 [NASA ADS] [CrossRef] [Google Scholar]
- Kaifu, N., Morimoto, M., Nagane, K., et al. 1974, ApJ, 191, L135 [Google Scholar]
- King, C. M., & Nixon, E. R. 1968, J. Chem. Phys., 48, 1685 [NASA ADS] [CrossRef] [Google Scholar]
- Kruczkiewicz, F., Vitorino, J., Congiu, E., Theulé, P., & Dulieu, F. 2021, A&A, 652, A29 [NASA ADS] [CrossRef] [EDP Sciences] [Google Scholar]
- Lacy, J. H., Carr, J. S., Evans, N. J., et al. 1991, ApJ, 376, 556 [NASA ADS] [CrossRef] [Google Scholar]
- Lee, C.-W., Kim, J.-K., Moon, E.-S., Minh, Y. C., & Kang, H. 2009, ApJ, 697, 428 [Google Scholar]
- Léger, A. 1983, A&A, 123, 271 [Google Scholar]
- Leger, A., Jura, M., & Omont, A. 1985, A&A, 144, 147 [Google Scholar]
- Leroi, G. E., Ewing, G. E., & Pimentel, G. C. 1964, J. Chem. Phys., 40, 2298 [NASA ADS] [CrossRef] [Google Scholar]
- Ligterink, N., Kristensen, L., Van Dishoeck, E., et al. 2018, 42nd COSPAR Scientific Assembly, 42, B1 [Google Scholar]
- Loomis, R. A., Zaleski, D. P., Steber, A. L., et al. 2013, ApJ, 765, L9 [Google Scholar]
- Luna, R., Molpeceres, G., Ortigoso, J., et al. 2018, A&A, 617, A116 [NASA ADS] [CrossRef] [EDP Sciences] [Google Scholar]
- Maier, G., & Endres, J. 2000, Eur. J. Org. Chem., 2000, 2535 [CrossRef] [Google Scholar]
- Maity, S., Kaiser, R. I., & Jones, B. M. 2015, Phys. Chem. Chem. Phys., 17, 3081 [NASA ADS] [CrossRef] [Google Scholar]
- Maret, S., Ceccarelli, C., Tielens, A. G. G. M., et al. 2005, A&A, 442, 527 [NASA ADS] [CrossRef] [EDP Sciences] [Google Scholar]
- McClure, M. K., Rocha, W. R. M., Pontoppidan, K. M., et al. 2023, Nat. Astron., 7, 431 [NASA ADS] [CrossRef] [Google Scholar]
- Moore, M. H., Ferrante, R. F., & Nuth III, J. A. 1996, Planet. Space Sci., 44, 927 [NASA ADS] [CrossRef] [Google Scholar]
- Naraoka, H., Takano, Y., Dworkin, J. P., et al. 2023, Science, 379, eabn9033 [CrossRef] [Google Scholar]
- Nazari, P., Meijerhof, J. D., van Gelder, M. L., et al. 2022, A&A, 668, A109 [NASA ADS] [CrossRef] [EDP Sciences] [Google Scholar]
- Öberg, K. I. 2016, Chem. Rev., 116, 9631 [Google Scholar]
- Öberg, K. I., Garrod, R. T., van Dishoeck, E. F., & Linnartz, H. 2009, A&A, 504, 891 [NASA ADS] [CrossRef] [EDP Sciences] [Google Scholar]
- Ohishi, M., Suzuki, T., Hirota, T., Saito, M., & Kaifu, N. 2019, PASJ, 71, 86 [NASA ADS] [CrossRef] [Google Scholar]
- Palumbo, M. E., Castorina, A. C., & Strazzulla, G. 1999, A&A, 342, 551 [NASA ADS] [Google Scholar]
- Räsänen, M., Aspiala, A., Homanen, L., & Murto, J. 1982, J. Mol. Struct., 96, 81 [Google Scholar]
- Requena-Torres, M. A., Marcelino, N., Jiménez-Serra, I., et al. 2007, ApJ, 655, L37 [CrossRef] [Google Scholar]
- Reva, I., Plokhotnichenko, A. M., Radchenko, E. D., Sheina, G. G., & Blagoi, Y. P. 1994, Spectrochim. Acta Part A: Mol. Spectrosc., 50, 1107 [NASA ADS] [CrossRef] [Google Scholar]
- Rivilla, V. M., Jiménez-Serra, I., Martín-Pintado, J., et al. 2021, PNAS, 118, e2101314118 [NASA ADS] [CrossRef] [Google Scholar]
- Rocha, W. R. M., van Dishoeck, E. F., Ressler, M. E., et al. 2024, A&A, 683, A124 [NASA ADS] [CrossRef] [EDP Sciences] [Google Scholar]
- Snyder, L. E., & Buhl, D. 1971, ApJ, 163, L47 [NASA ADS] [CrossRef] [Google Scholar]
- Snyder, L. E., & Buhl, D. 1972, ApJ, 177, 619 [Google Scholar]
- Snyder, L. E., Buhl, D., Zuckerman, B., & Palmer, P. 1969, Phys. Rev. Lett., 22, 679 [Google Scholar]
- Snyder, L. E., Buhl, D., Schwartz, P. R., et al. 1974, ApJ, 191, L79 [NASA ADS] [CrossRef] [Google Scholar]
- Snyder, L. E., Hollis, J. M., & Ulich, B. L. 1976, ApJ, 208, L91 [NASA ADS] [CrossRef] [Google Scholar]
- Solomon, P. M., Jefferts, K. B., Penzias, A. A., & Wilson, R. W. 1971, ApJ, 168, L107 [Google Scholar]
- Sorrell, W. H. 2001, ApJ, 555, L129 [NASA ADS] [CrossRef] [Google Scholar]
- Spezzano, S., Fuente, A., Caselli, P., et al. 2022, A&A, 657, A10 [NASA ADS] [CrossRef] [EDP Sciences] [Google Scholar]
- Stolkin, I., Ha, T.-K., & Günthard, H. H. 1977, Chem. Phys., 21, 327 [NASA ADS] [CrossRef] [Google Scholar]
- Sullivan, K. K., Boamah, M. D., Shulenberger, K. E., et al. 2016, MNRAS, 460, 664 [NASA ADS] [CrossRef] [Google Scholar]
- Suzuki, T., Majumdar, L., Goldsmith, P. F., et al. 2023, ApJ, 954, 189 [NASA ADS] [CrossRef] [Google Scholar]
- Teles, J. H., Maier, G., Hess Jr, A. B., et al. 1989, Chem. Ber., 122, 753 [CrossRef] [Google Scholar]
- van Broekhuizen, F. A., Keane, J. V., & Schutte, W. A. 2004, A&A, 415, 425 [NASA ADS] [CrossRef] [EDP Sciences] [Google Scholar]
- van Dishoeck, E. F., & Blake, G. A. 1998, Annu. Rev. Astron. Astrophys., 36, 317 [CrossRef] [Google Scholar]
- van Dishoeck, E. F., Grant, S., Tabone, B., et al. 2023, Faraday Discuss., 245, 52 [NASA ADS] [CrossRef] [Google Scholar]
- van Gelder, M. L., Nazari, P., Tabone, B., et al. 2022, A&A, 662, A67 [NASA ADS] [CrossRef] [EDP Sciences] [Google Scholar]
- Vinogradoff, V., Duvernay, F., Danger, G., et al. 2013, A&A, 549, A40 [NASA ADS] [CrossRef] [EDP Sciences] [Google Scholar]
- Watson, W. D., & Salpeter, E. E. 1972, ApJ, 174, 321 [NASA ADS] [CrossRef] [Google Scholar]
- Whittet, D. C. B., Schutte, W. A., Tielens, A. G. G. M., et al. 1996, A&A, 315, L357 [Google Scholar]
- Wilson, R. W., Jefferts, K. B., & Penzias, A. A. 1970, ApJ, 161, L43 [NASA ADS] [CrossRef] [Google Scholar]
- Yocum, K. M., Smith, H. H., Todd, E. W., et al. 2019, J. Phys. Chem. A, 123, 8702 [NASA ADS] [CrossRef] [Google Scholar]
- Zeng, S., Jiménez-Serra, I., Rivilla, V. M., et al. 2021, ApJ Lett., 920, L27 [NASA ADS] [CrossRef] [Google Scholar]
- Zuckerman, B., Ball, J. A., & Gottlieb, C. A. 1971, ApJ, 163, L41 [NASA ADS] [CrossRef] [Google Scholar]
All Tables
All Figures
|
Fig. 1 IR spectra recorded during the TPD of pure CH3OH ice, zoomed in on key spectral bands. Lower panel: spectra of the ice at 3 K (red), 120 K (blue), and 160 K (brown). Upper panel: IR spectra of the desorbing species as deposited in an Ar matrix. The species were accumulated in the Ar matrix between 175 K and 220 K (green), 175 K and 260 K (purple), and 175 K and 300 K (orange). |
| In the text | |
|
Fig. 2 IR spectra recorded during the TPD of pure CH3NH2 ice, zoomed in on key spectral bands. Lower panel: spectra of the ice at 3 K (red), 120 K (blue), and 160 K (brown). Upper panel: IR spectra of the desorbing species as deposited in an Ar matrix. The species were accumulated in the Ar matrix between 175 K and 220 K (green), 175 K and 260 K (purple), and 175 K and 300 K (orange). |
| In the text | |
|
Fig. 3 Difference spectrum of electron bombarded CH3OH:CH3NH2 ice at 3 K, zoomed in on key spectral bands. The difference spectrum was obtained by subtracting the MIR spectrum recorded after the electron bombardment from the spectrum recorded after the deposition. |
| In the text | |
|
Fig. 4 IR spectra recorded during the TPD of CH3OH:CH3NH2 ice, zoomed in on key spectral bands. Lower panel: Spectra of the ice at 3 K (red), 120 K (blue), and 160 K (brown). Upper panel: IR spectra of the desorbing species as deposited in an Ar matrix. The species were accumulated in the Ar matrix between 175 K and 220 K (green), 175 K and 260 K (purple), and 175 K and 300 K (orange). |
| In the text | |
Current usage metrics show cumulative count of Article Views (full-text article views including HTML views, PDF and ePub downloads, according to the available data) and Abstracts Views on Vision4Press platform.
Data correspond to usage on the plateform after 2015. The current usage metrics is available 48-96 hours after online publication and is updated daily on week days.
Initial download of the metrics may take a while.