Fig. 2
Download original image
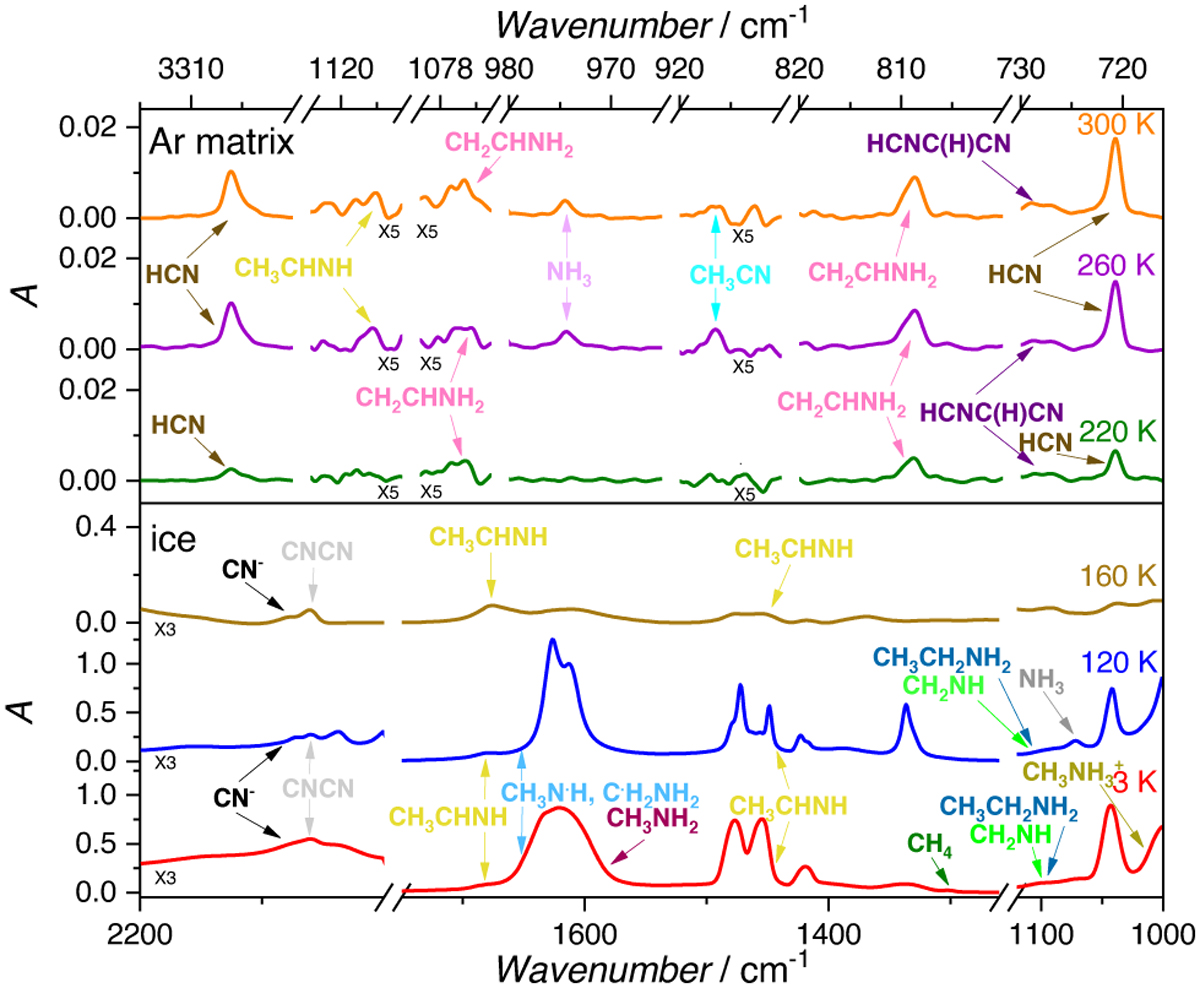
IR spectra recorded during the TPD of pure CH3NH2 ice, zoomed in on key spectral bands. Lower panel: spectra of the ice at 3 K (red), 120 K (blue), and 160 K (brown). Upper panel: IR spectra of the desorbing species as deposited in an Ar matrix. The species were accumulated in the Ar matrix between 175 K and 220 K (green), 175 K and 260 K (purple), and 175 K and 300 K (orange).
Current usage metrics show cumulative count of Article Views (full-text article views including HTML views, PDF and ePub downloads, according to the available data) and Abstracts Views on Vision4Press platform.
Data correspond to usage on the plateform after 2015. The current usage metrics is available 48-96 hours after online publication and is updated daily on week days.
Initial download of the metrics may take a while.