Fig. 2
Download original image
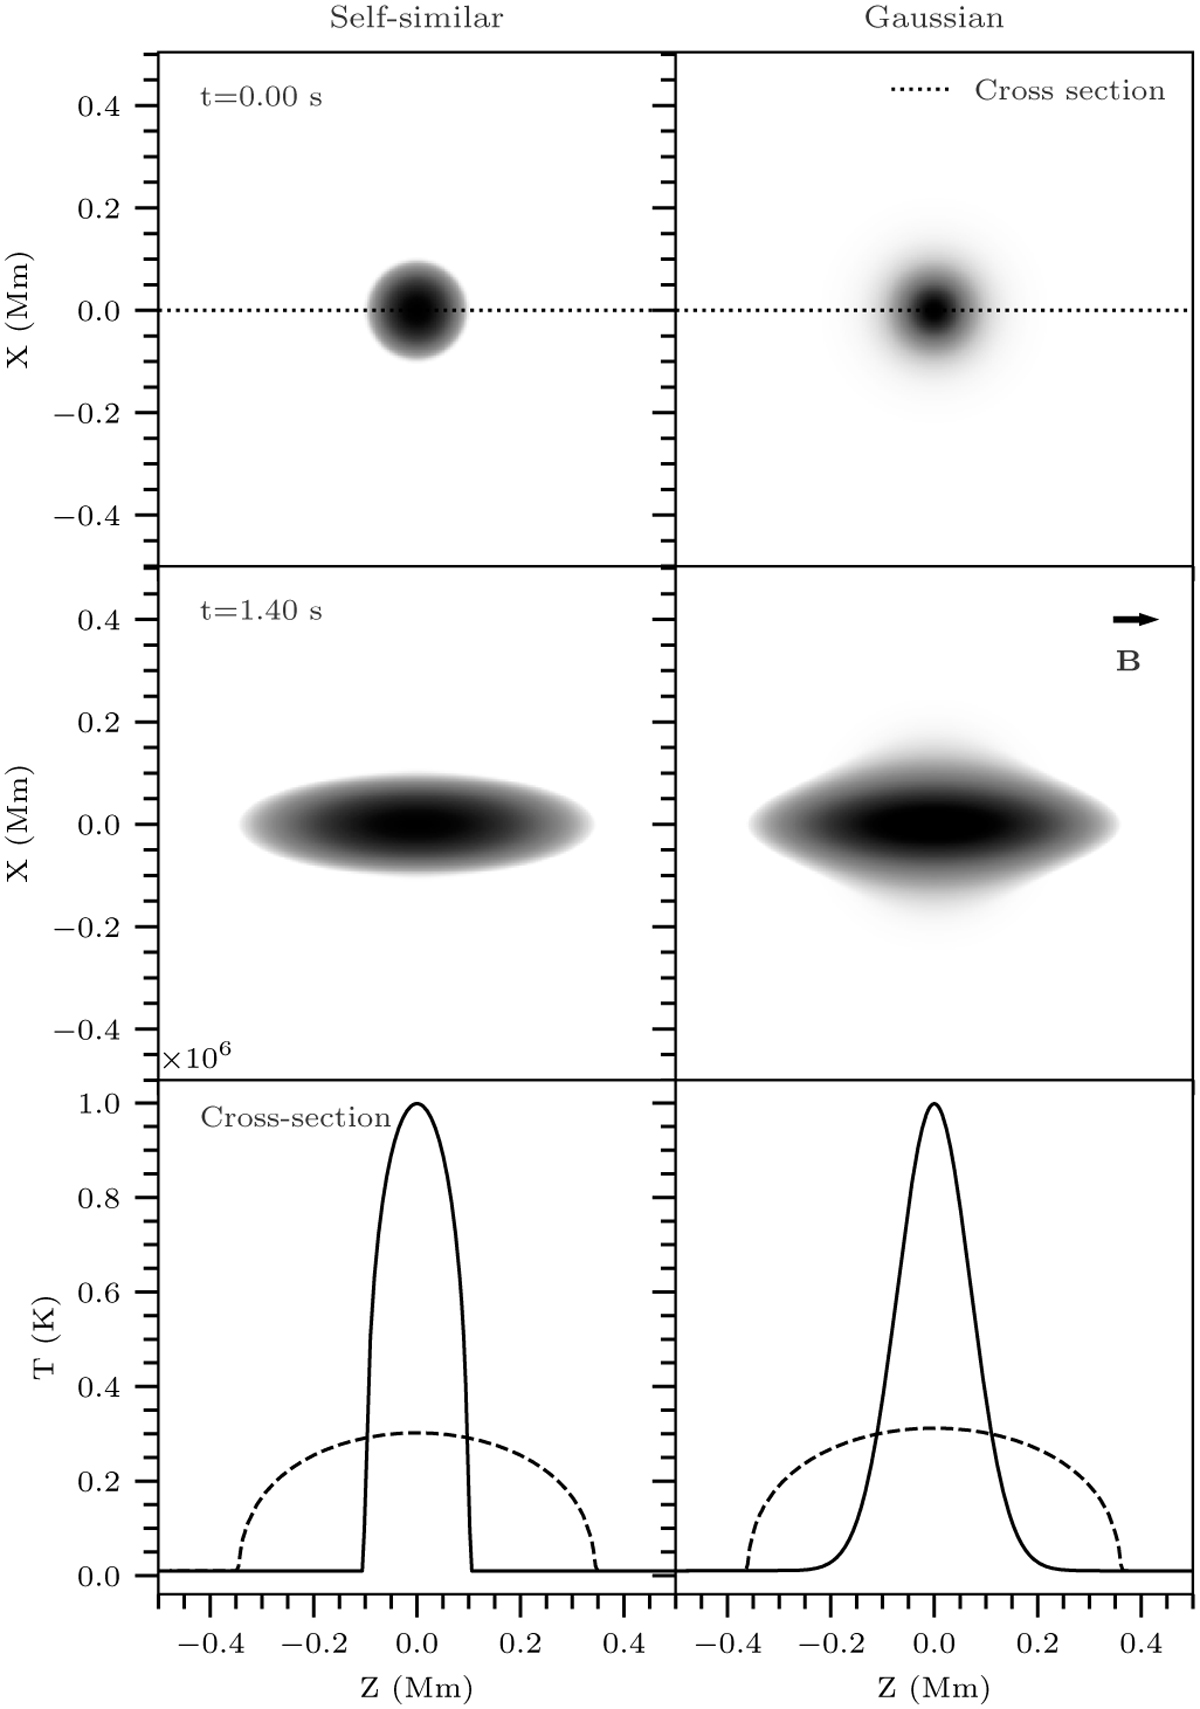
Evolution of the self-similar diffusion test for Gaussian and selfsimilar initial conditions. At t = 1.40 s, the profile lies in the χ t >> 1 regime and both initial profiles show a self-similar diffused profile, albeit for different ϕ0 . The solutions are run with the explicit method for Δt = 10−5 s. We note that different scales are used for the colour maps between t = 0 s and t = 1.4 s.
Current usage metrics show cumulative count of Article Views (full-text article views including HTML views, PDF and ePub downloads, according to the available data) and Abstracts Views on Vision4Press platform.
Data correspond to usage on the plateform after 2015. The current usage metrics is available 48-96 hours after online publication and is updated daily on week days.
Initial download of the metrics may take a while.