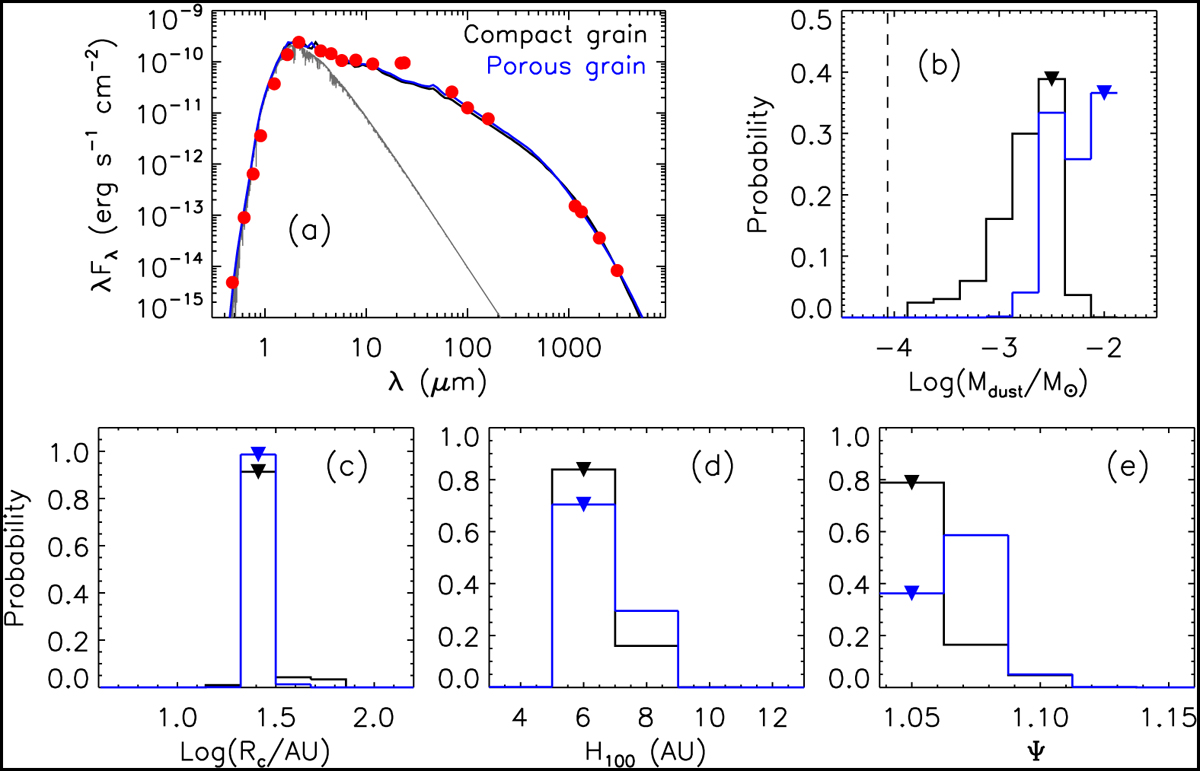
Fig. 7
Download original image
Fitting results of the IRAS 04370+2559 disk. Panel a: SEDs of IRAS 04370+2559. The best-fit radiative transfer models with compact dust opacities and porous dust opacities are shown with black lines and blue lines, respectively. The grey curve refers to the input BT-Settl spectrum, and photometric data points are overlaid with red dots. Panels b–e: Bayesian probability distributions for Log10(Mdust/M⊙), Log10(Rc/AU), H100, and Ψ. The triangles indicate the best-fit parameter values. The vertical dashed line in panel b marks the analytic dust mass calculated with Eq. (1) by assuming Tdust = 20 K and κ1.3mm = 2.3 cm2/g.
Current usage metrics show cumulative count of Article Views (full-text article views including HTML views, PDF and ePub downloads, according to the available data) and Abstracts Views on Vision4Press platform.
Data correspond to usage on the plateform after 2015. The current usage metrics is available 48-96 hours after online publication and is updated daily on week days.
Initial download of the metrics may take a while.