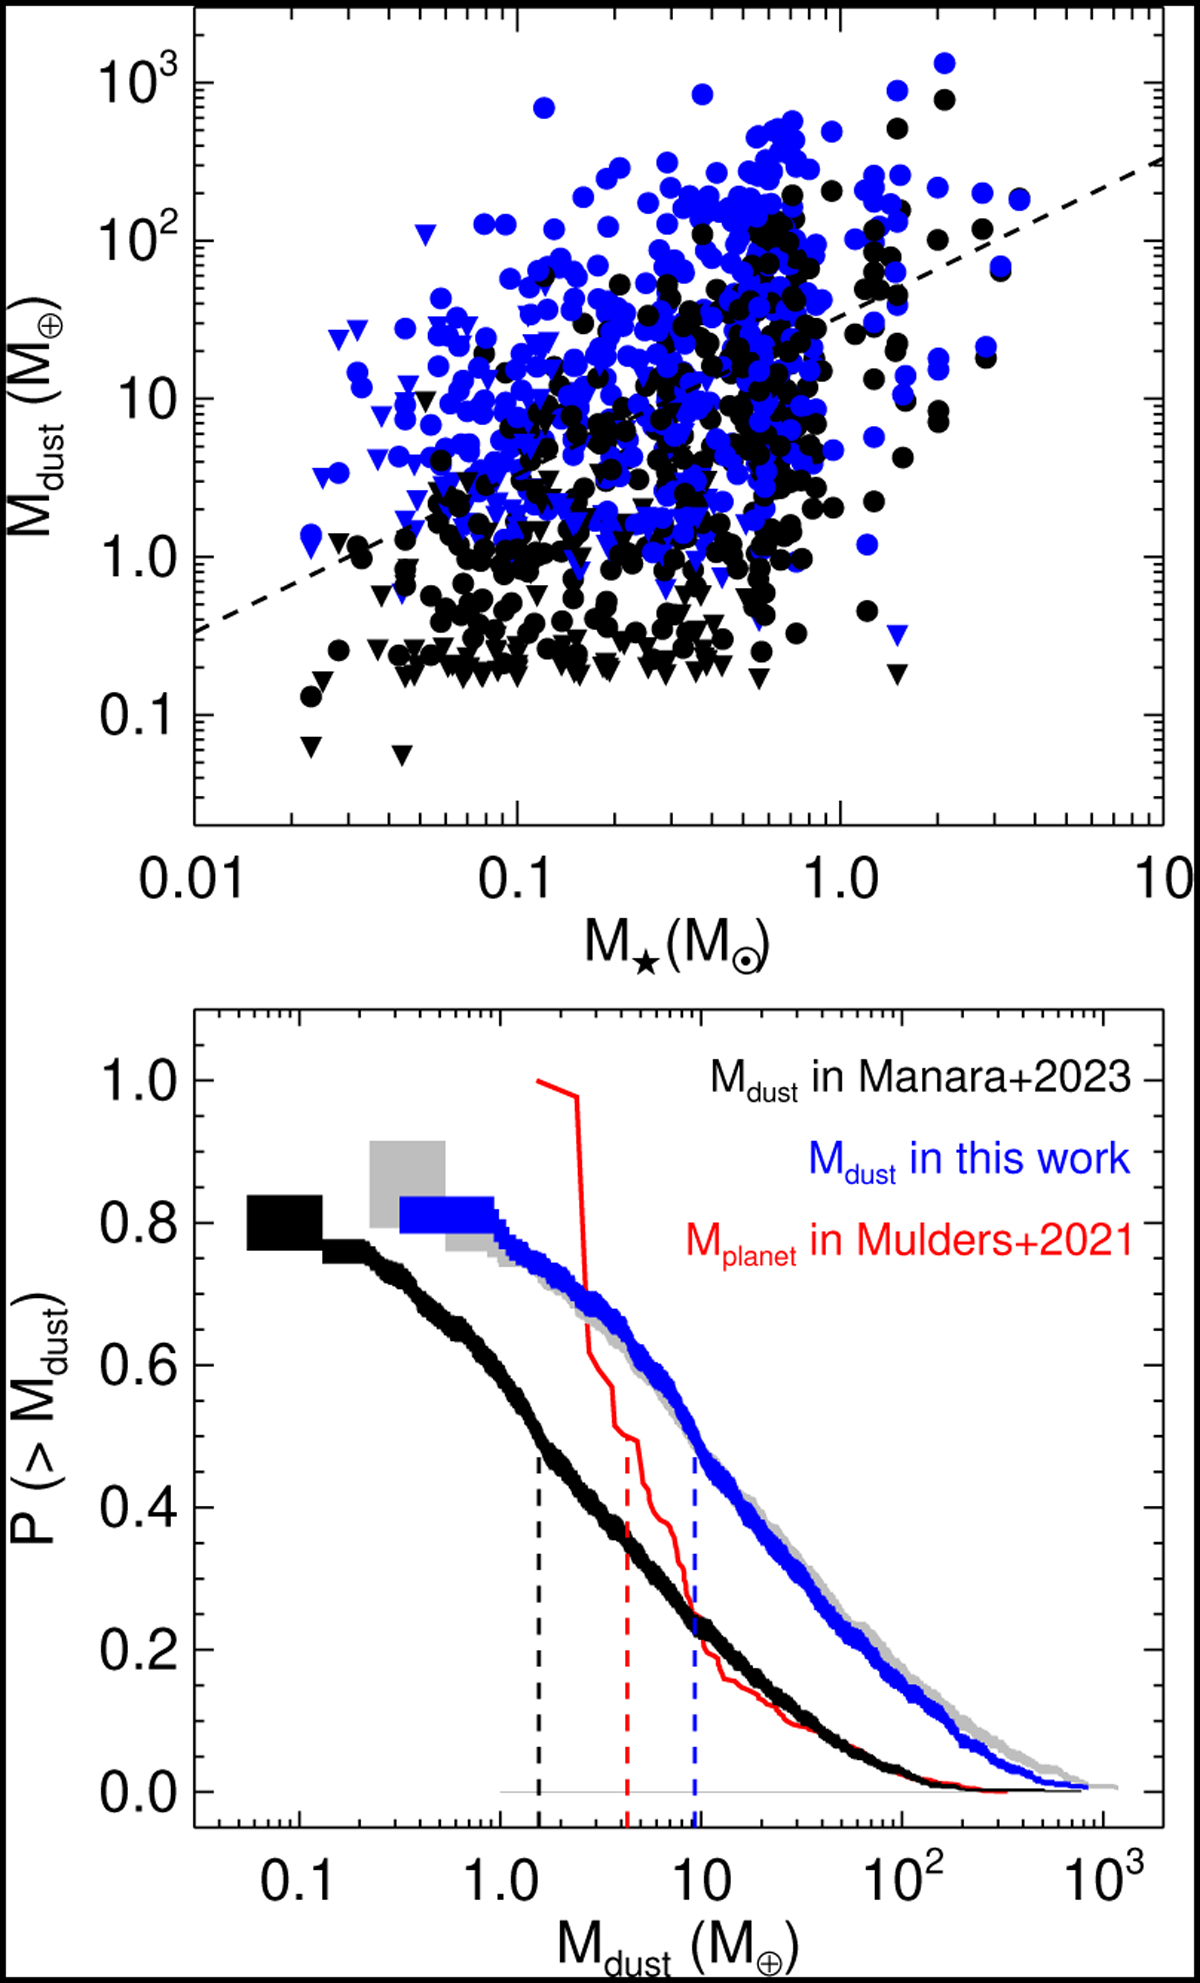
Fig. 6
Download original image
Dust masses in protoplanetary disks and their statistics. Upper panel: Mdust as a function of M⋆. Black symbols show the results derived by Manara et al. (2023), while blue symbols represent our calculations considering porous dust opacities and a Tdust − L⋆ scaling given by Eq. (6), see Sect. 3. Millimeter detections are indicated with dots, whereas triangles mean upper limits of the millimeter flux are reported. The dashed line depicts the value of 100·Mdust = 0.01·M⋆. Bottom panel: CDF of Mdust. The grey curve shows the result calculated with porous dust opacities and a constant dust temperature Tdust = 20 K. The red curve refers to the distribution of exoplanet masses obtained by Mulders et al. (2021). The vertical dashed lines mark the median values of each distribution.
Current usage metrics show cumulative count of Article Views (full-text article views including HTML views, PDF and ePub downloads, according to the available data) and Abstracts Views on Vision4Press platform.
Data correspond to usage on the plateform after 2015. The current usage metrics is available 48-96 hours after online publication and is updated daily on week days.
Initial download of the metrics may take a while.