Fig. 5
Download original image
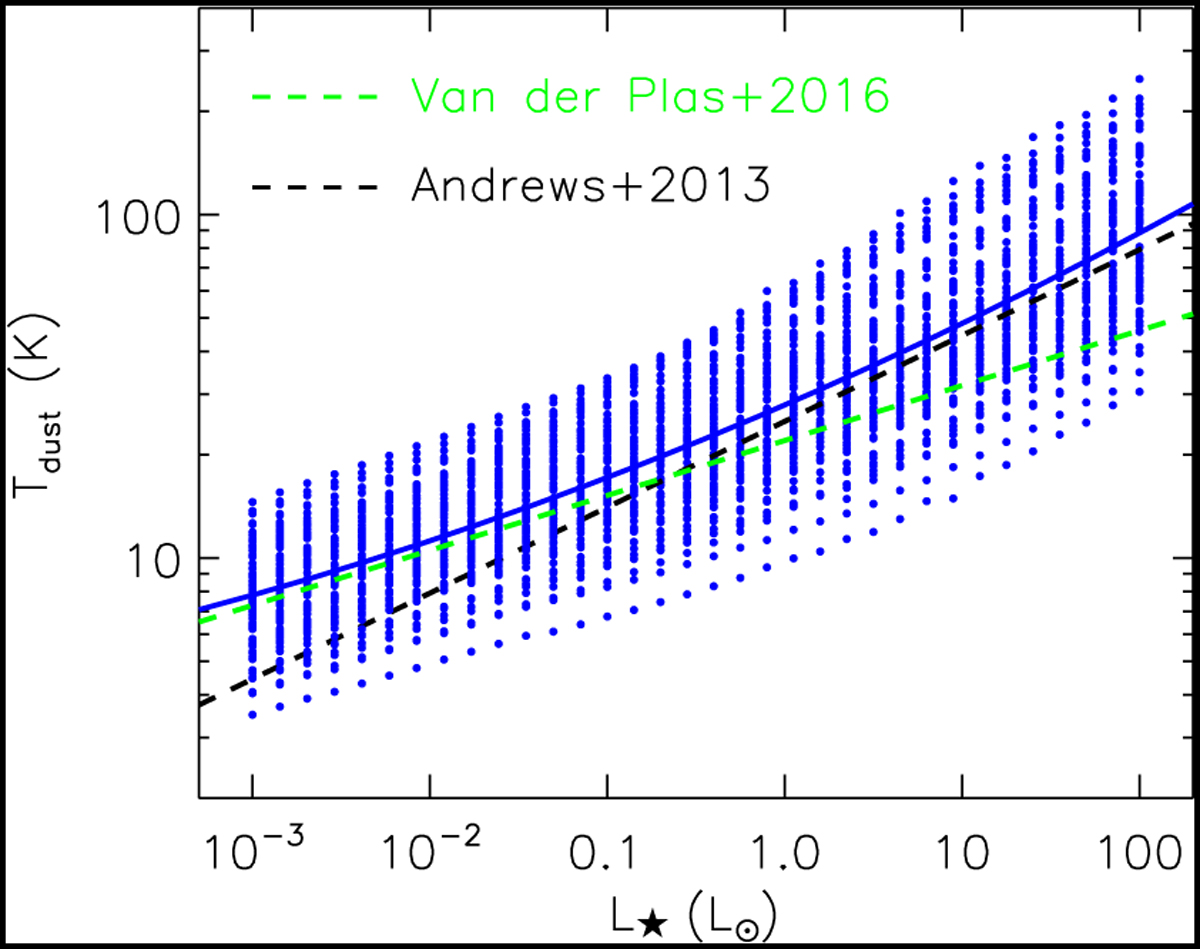
Mass-averaged dust temperature as a function of stellar luminosity. The blue solid curve, expressed as log Tdust = 1.445 + 0.224 log L⋆ + 0.013 (log L⋆)2 is the best-fit relation to our models. The black dashed line refers to the relation Tdust = 25 (L⋆/L⊙)0.25 K presented by Andrews et al. (2013). The green dashed line shows the relation Tdust = 22 (L⋆/L⊙)0.16 K suggested by van der Plas et al. (2016).
Current usage metrics show cumulative count of Article Views (full-text article views including HTML views, PDF and ePub downloads, according to the available data) and Abstracts Views on Vision4Press platform.
Data correspond to usage on the plateform after 2015. The current usage metrics is available 48-96 hours after online publication and is updated daily on week days.
Initial download of the metrics may take a while.