Fig. 4
Download original image
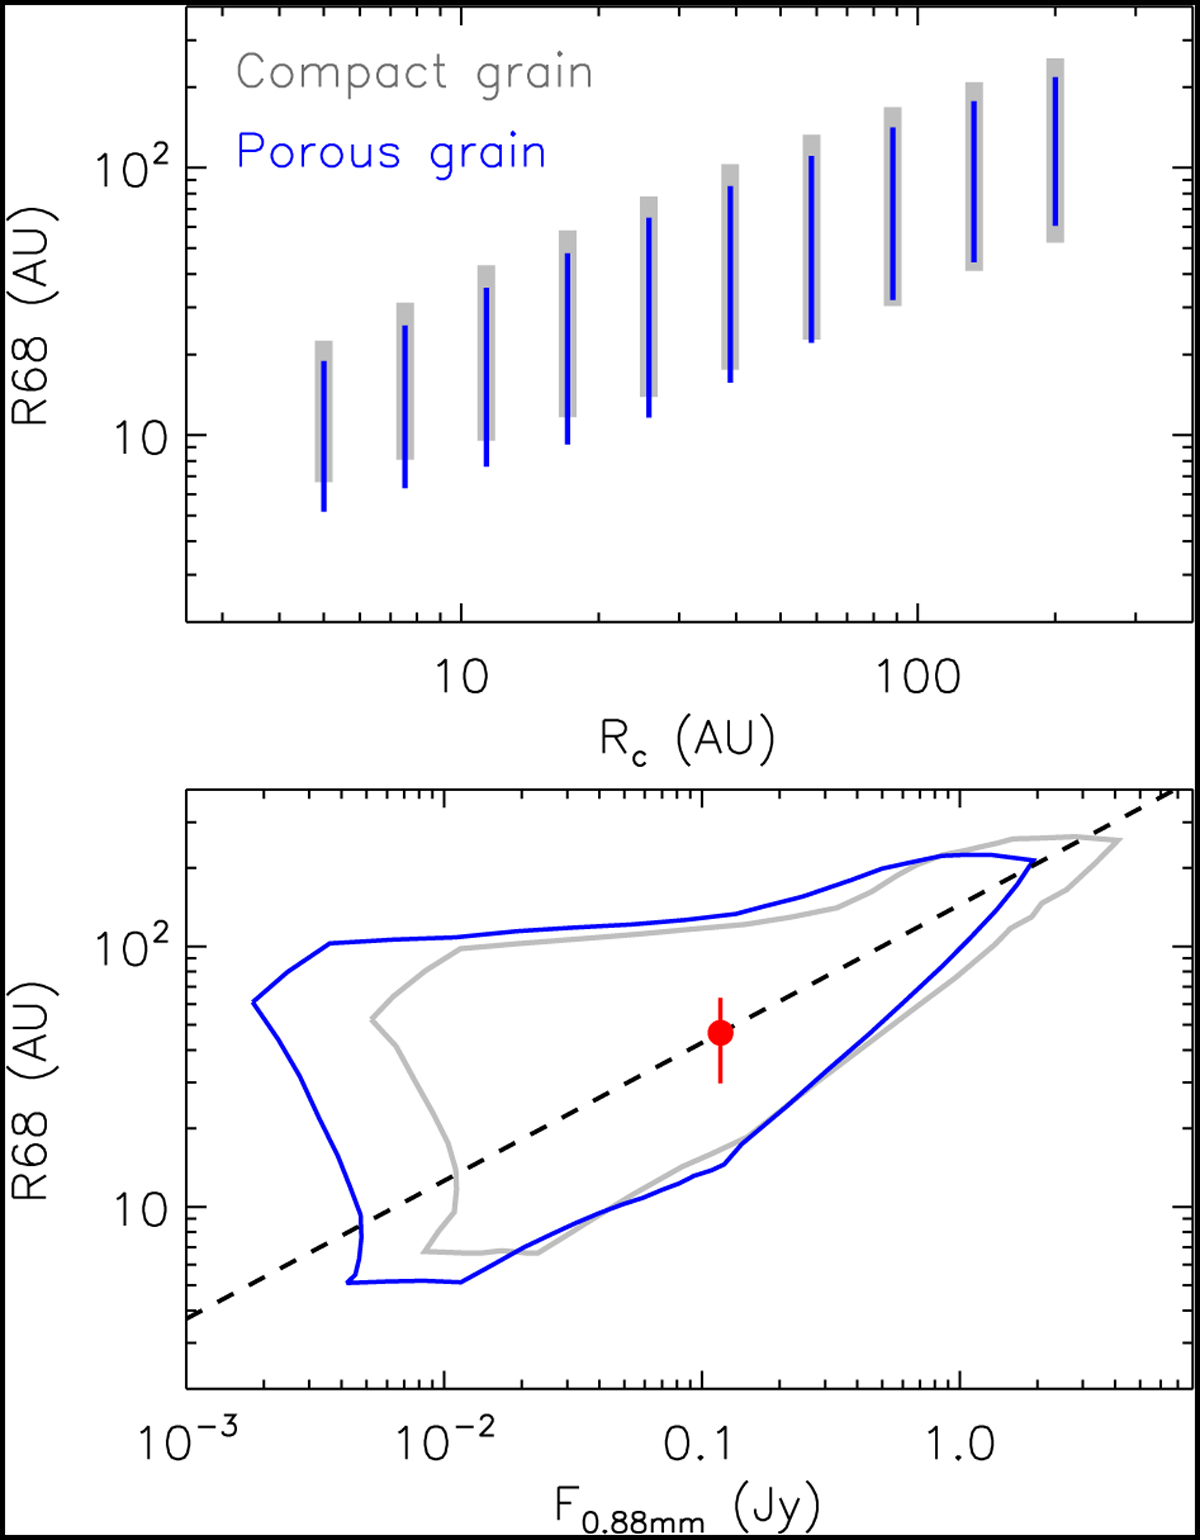
Statistics of the effective disk radius R68 from the model grid. Upper panel: ranges of R68 for each of the sampled Rc. The blue lines refer to the result when porous dust grains are considered, whereas the grey lines represent the case by using compact dust opacities. The thickness of lines is only for a better illustration. Bottom panel: relation between R68 and F0.88mm. The blue curve and grey curves enclose the regions occupied by the 9360 models with porous grains and compact grains, respectively. The dashed line shows the relation log R68 = 2.16 + 0.53 log F0.88mm (Hendler et al. 2020). The red dot indicates the expected position of IRAS 04370+2559 in the diagram; for details, see Sect. 4.2.
Current usage metrics show cumulative count of Article Views (full-text article views including HTML views, PDF and ePub downloads, according to the available data) and Abstracts Views on Vision4Press platform.
Data correspond to usage on the plateform after 2015. The current usage metrics is available 48-96 hours after online publication and is updated daily on week days.
Initial download of the metrics may take a while.