Open Access
Fig. 7
Download original image
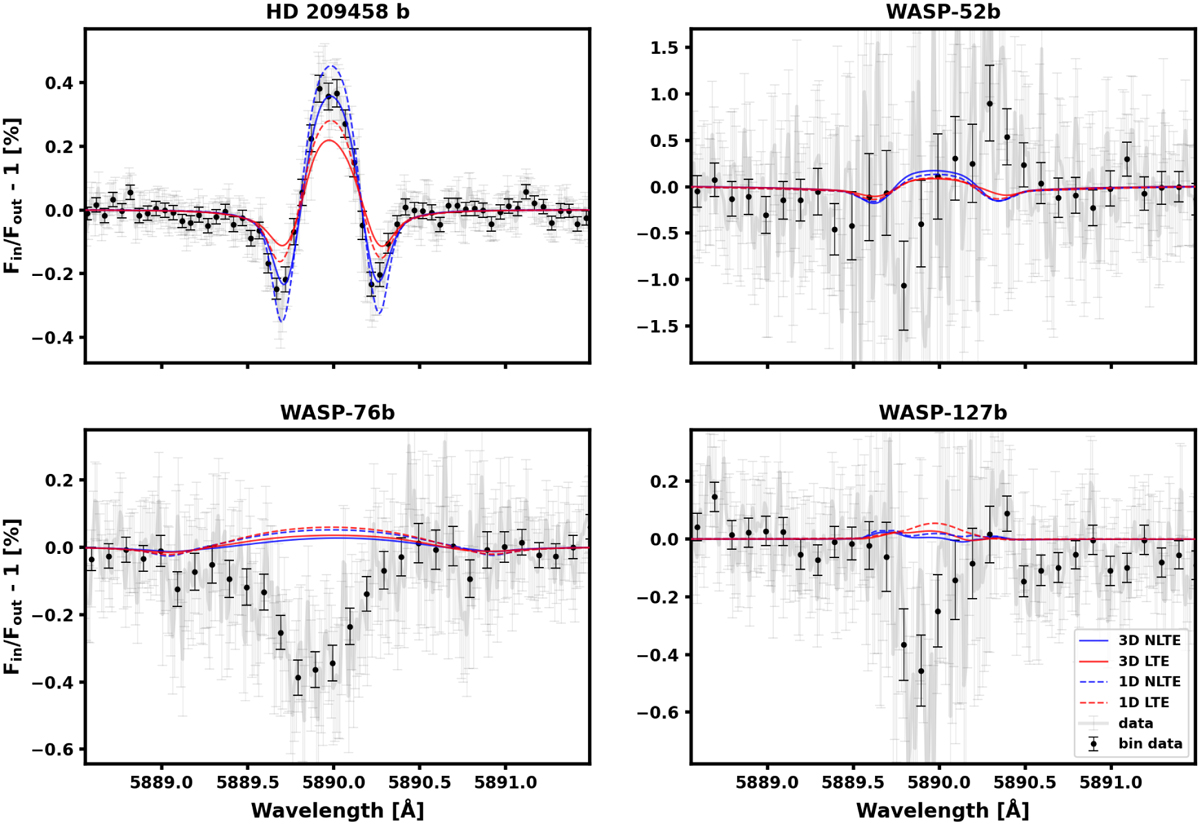
Same as Fig. 5, but zoomed-in on the Na I D2 line. The CLV+RM model from different synthetic stellar spectra is overplotted: 3D NLTE (solid blue line), 3D LTE (solid red line), 1D NLTE (dashed blue line), and 1D LTE (dashed red line).
Current usage metrics show cumulative count of Article Views (full-text article views including HTML views, PDF and ePub downloads, according to the available data) and Abstracts Views on Vision4Press platform.
Data correspond to usage on the plateform after 2015. The current usage metrics is available 48-96 hours after online publication and is updated daily on week days.
Initial download of the metrics may take a while.