Open Access
Fig. 3
Download original image
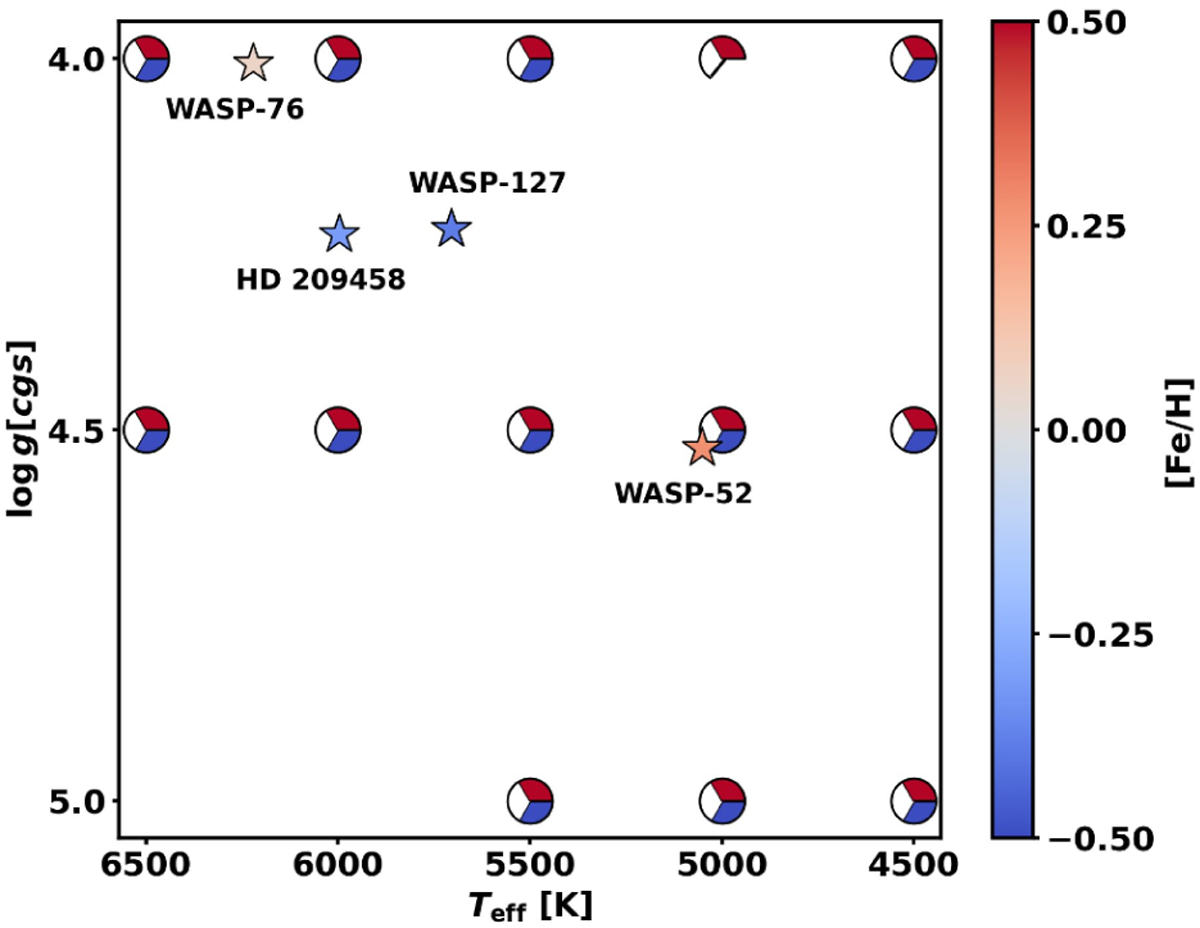
Hertzsprung-Russel diagram illustrating the STAGGER-grid nodes at which the 3D NLTE computations were performed for [Fe/H] = −0.5 (blue), 0.0 (white), and +0.5 (red). Additionally, the four host stars of the gas giants are overplotted, colored by their metallicity.
Current usage metrics show cumulative count of Article Views (full-text article views including HTML views, PDF and ePub downloads, according to the available data) and Abstracts Views on Vision4Press platform.
Data correspond to usage on the plateform after 2015. The current usage metrics is available 48-96 hours after online publication and is updated daily on week days.
Initial download of the metrics may take a while.