Fig. A.4
Download original image
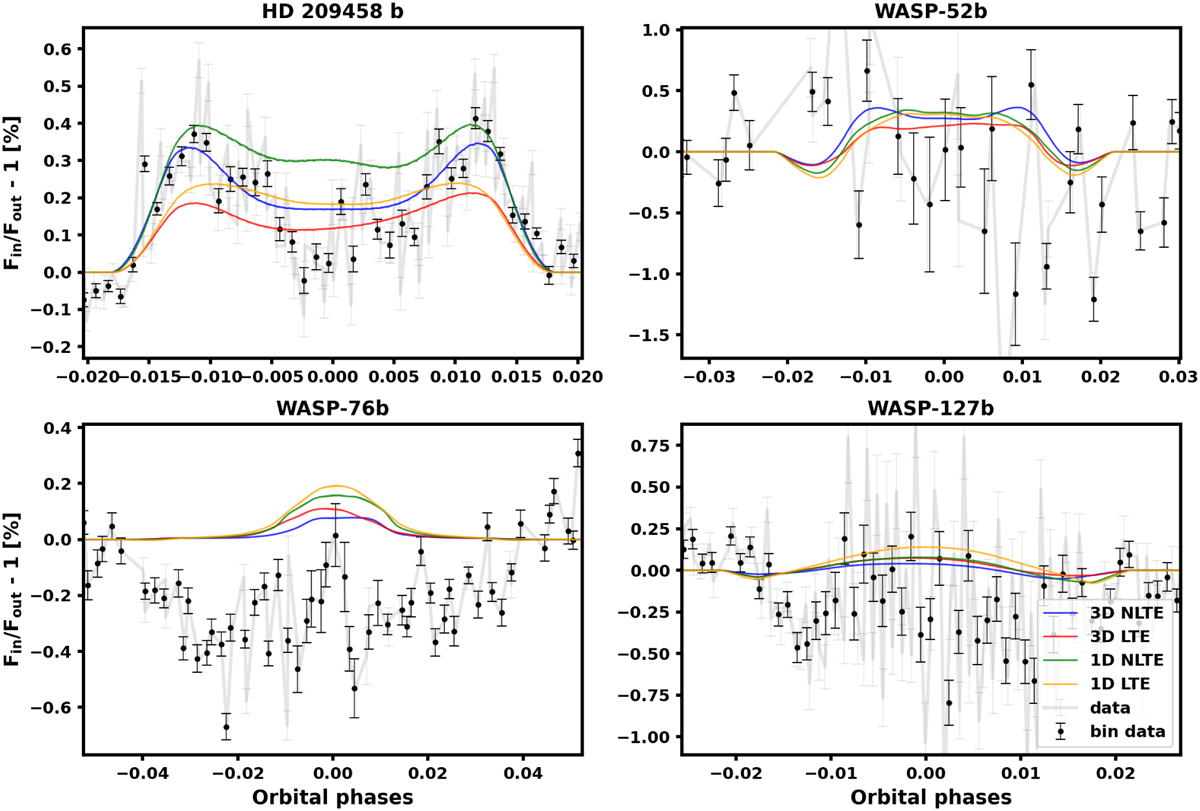
Transmission LCs in a 0.4 Å passband centered on the Na I D lines. The gray dots represent the original data, whereas the black dots are the data binned to 0.001 in orbital phase. The CLV+RM model from different synthetic stellar spectra is overplotted, colored as in the figure’s legend. It is worth noticing the different scale of the y-axis.
Current usage metrics show cumulative count of Article Views (full-text article views including HTML views, PDF and ePub downloads, according to the available data) and Abstracts Views on Vision4Press platform.
Data correspond to usage on the plateform after 2015. The current usage metrics is available 48-96 hours after online publication and is updated daily on week days.
Initial download of the metrics may take a while.