Open Access
Fig. A.1
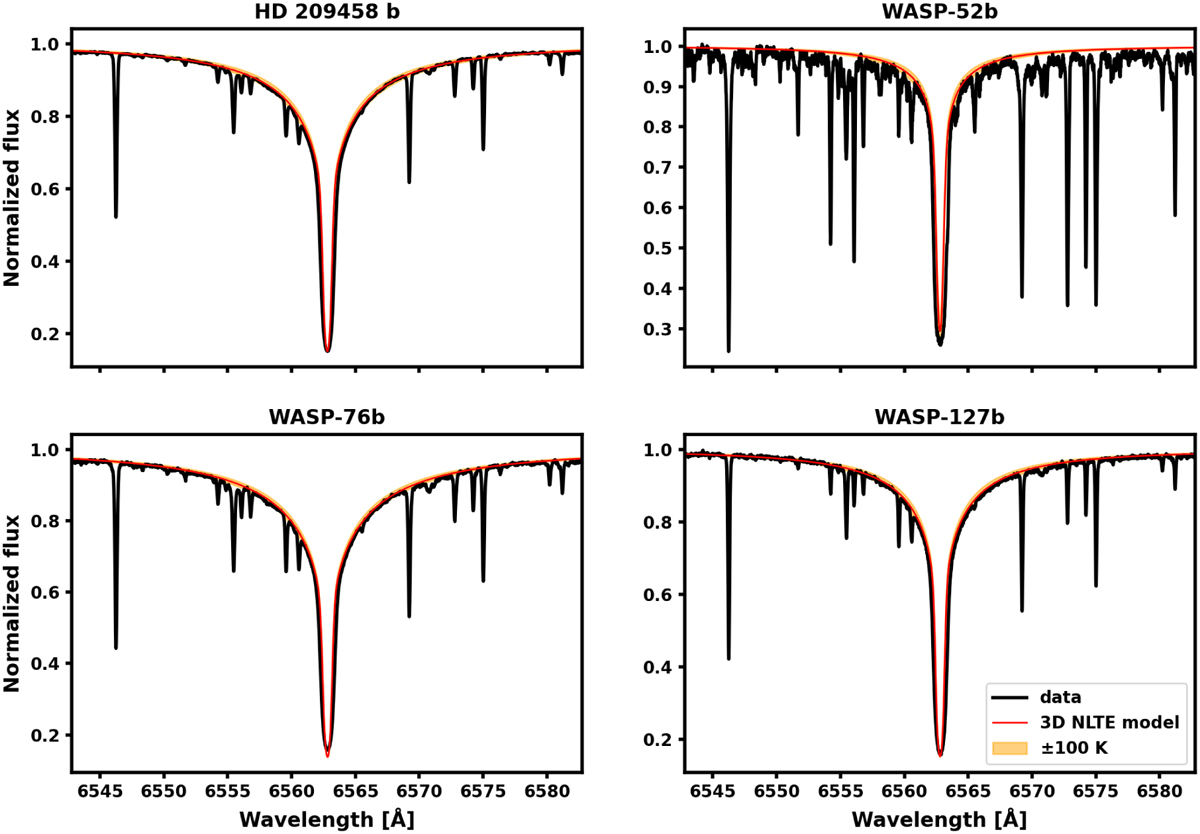
Download original image
Master Out around the Hα line profiles observed with ESPRESSO in the four target stars, compared to the 3D NLTE model with Teff, log g, [Fe/H], and v sin i⋆ listed in Table 2. The orange shaded region indicates the effect of adjusting the Teff by ± 100 K.
Current usage metrics show cumulative count of Article Views (full-text article views including HTML views, PDF and ePub downloads, according to the available data) and Abstracts Views on Vision4Press platform.
Data correspond to usage on the plateform after 2015. The current usage metrics is available 48-96 hours after online publication and is updated daily on week days.
Initial download of the metrics may take a while.