Open Access
Fig. 12
Download original image
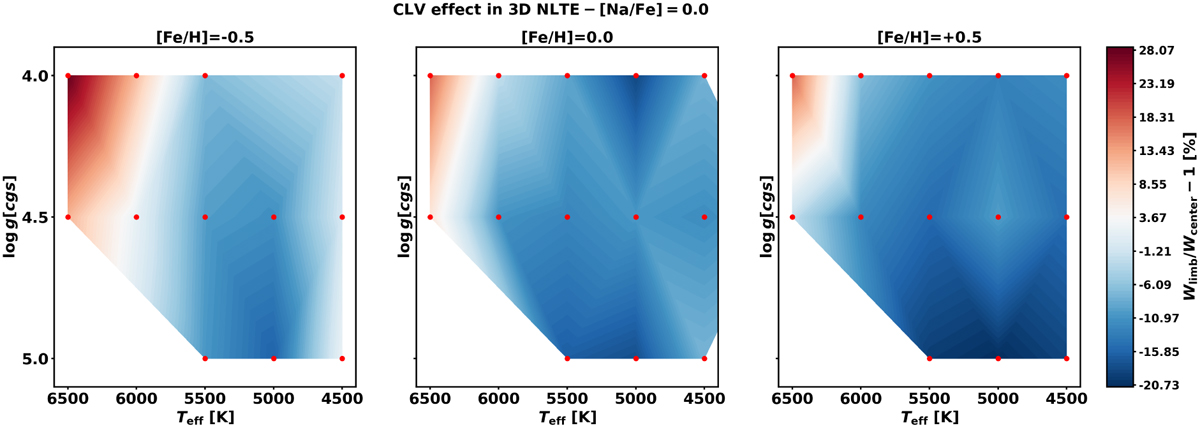
CLV effect across the STAGGER grid for FGK-type stars. The panels show the ratio of the combined equivalent width of the Na I D lines from 3D NLTE synthetic spectra at the limb (μ = 0.1) and at the disk center (μ = 1.0). The red dots indicate the grid nodes at which the synthetic spectra were computed.
Current usage metrics show cumulative count of Article Views (full-text article views including HTML views, PDF and ePub downloads, according to the available data) and Abstracts Views on Vision4Press platform.
Data correspond to usage on the plateform after 2015. The current usage metrics is available 48-96 hours after online publication and is updated daily on week days.
Initial download of the metrics may take a while.